Lysyl-Trna Synthetase
(All numbering and residues are taken from first PDB file)
![]()
![]()
Bending Residue Dihedral Analysis
Residue
iResidue
i+1Distance of hinge axis to residue i in
(A) Distance of hinge axis to residue i in
(A) Change in
(deg) Change in
(deg) Angle of psi(i) axis to hinge axis
(deg) Angle of psi(i) axis to hinge axis
(deg) Percentage Progress
ILE-290
GLU-291
5.9
6.0
-1.5
12.3
160.9
158.3
300.2
GLU-291
LEU-292
5.3
5.5
-11.2
6.6
105.5
105.8
-154.5
LEU-292
THR-293
1.5
1.7
1.7
-1.6
76.4
75.4
-29.1
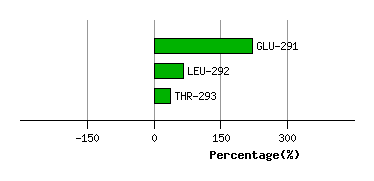
Graph shows rotational transition at bending residues and can be used
to identify hinge bending residues.
Probably only informative for interdomain rotations greater than 20 degrees
Residue
iResidue
i+1Distance of hinge axis to residue i in
(A) Distance of hinge axis to residue i in
(A) Change in
(deg) Change in
(deg) Angle of psi(i) axis to hinge axis
(deg) Angle of psi(i) axis to hinge axis
(deg) Percentage Progress
GLU-294
SER-295
5.4
5.2
2.2
-2.9
136.7
137.5
-73.6
SER-295
LEU-296
2.2
2.0
-5.4
11.9
83.3
86.8
-38.5
LEU-296
PHE-297
3.4
3.2
-19.4
11.1
58.6
54.2
179.6
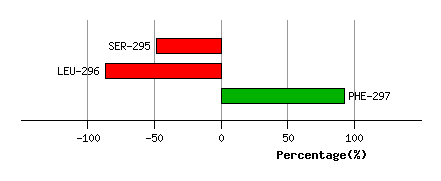
Graph shows rotational transition at bending residues and can be used
to identify hinge bending residues.
Probably only informative for interdomain rotations greater than 20 degrees
Residue
iResidue
i+1Distance of hinge axis to residue i in
(A) Distance of hinge axis to residue i in
(A) Change in
(deg) Change in
(deg) Angle of psi(i) axis to hinge axis
(deg) Angle of psi(i) axis to hinge axis
(deg) Percentage Progress
PHE-317
ASP-318
15.4
15.6
4.2
-4.5
52.0
53.2
-52.2
ASP-318
PHE-319
12.9
13.1
-12.1
9.8
52.5
55.2
75.3
PHE-319
GLY-320
9.6
9.7
-11.1
0.8
110.7
110.4
44.0
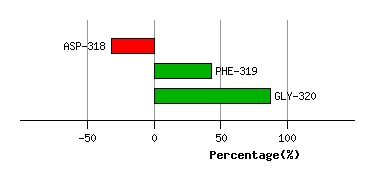
Graph shows rotational transition at bending residues and can be used
to identify hinge bending residues.
Probably only informative for interdomain rotations greater than 20 degrees
Residue
iResidue
i+1Distance of hinge axis to residue i in
(A) Distance of hinge axis to residue i in
(A) Change in
(deg) Change in
(deg) Angle of psi(i) axis to hinge axis
(deg) Angle of psi(i) axis to hinge axis
(deg) Percentage Progress
PRO-393
ALA-394
13.4
13.6
0.5
1.0
66.0
66.7
-5.9
ALA-394
GLU-395
10.4
10.6
0.5
-1.1
59.6
64.3
74.9
GLU-395
VAL-396
11.7
11.8
-1.3
6.4
60.5
56.2
-71.7
VAL-396
SER-397
11.8
11.8
6.2
-8.3
122.0
119.4
41.6
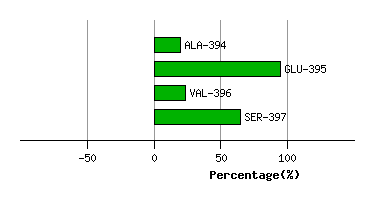
Graph shows rotational transition at bending residues and can be used
to identify hinge bending residues.
Probably only informative for interdomain rotations greater than 20 degrees
Residue
iResidue
i+1Distance of hinge axis to residue i in
(A) Distance of hinge axis to residue i in
(A) Change in
(deg) Change in
(deg) Angle of psi(i) axis to hinge axis
(deg) Angle of psi(i) axis to hinge axis
(deg) Percentage Progress
ILE-417
GLY-418
15.9
15.7
9.7
-10.4
92.8
88.9
50.9
GLY-418
GLY-419
19.4
19.2
3.5
-0.1
32.8
30.7
0.5
GLY-419
ARG-420
20.8
20.5
-3.2
-1.3
134.5
137.0
-97.2
ARG-420
GLU-421
18.7
18.5
6.5
-5.2
74.8
79.7
183.6
GLU-421
ILE-422
15.5
15.2
-2.5
0.8
62.9
65.8
39.5
ILE-422
GLY-423
13.0
12.7
13.2
-8.7
59.8
64.5
80.7
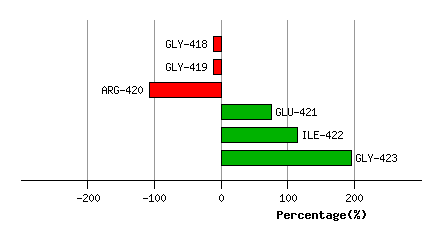
Graph shows rotational transition at bending residues and can be used
to identify hinge bending residues.
Probably only informative for interdomain rotations greater than 20 degrees
Residue
iResidue
i+1Distance of hinge axis to residue i in
(A) Distance of hinge axis to residue i in
(A) Change in
(deg) Change in
(deg) Angle of psi(i) axis to hinge axis
(deg) Angle of psi(i) axis to hinge axis
(deg) Percentage Progress
GLU-452
ALA-453
17.0
17.1
-8.0
8.1
80.2
79.3
-19.6
ALA-453
MET-454
13.8
13.8
5.2
-13.4
89.4
88.7
57.8
MET-454
PHE-455
11.1
11.3
6.7
-0.8
150.1
152.2
-123.4
PHE-455
TYR-456
11.3
11.3
15.6
-12.8
82.0
82.6
-27.4
PHE-455
TYR-456
11.3
11.3
15.6
-12.8
82.0
82.6
-27.4
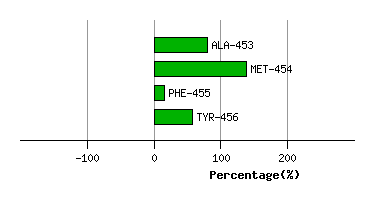
Graph shows rotational transition at bending residues and can be used
to identify hinge bending residues.
Probably only informative for interdomain rotations greater than 20 degrees
Residue
iResidue
i+1Distance of hinge axis to residue i in
(A) Distance of hinge axis to residue i in
(A) Change in
(deg) Change in
(deg) Angle of psi(i) axis to hinge axis
(deg) Angle of psi(i) axis to hinge axis
(deg) Percentage Progress
PHE-455
TYR-456
11.3
11.3
15.6
-12.8
82.0
82.6
-27.4
PHE-455
TYR-456
11.3
11.3
15.6
-12.8
82.0
82.6
-27.4
TYR-456
ASP-457
8.5
8.6
-16.9
20.5
74.4
75.4
43.8
ASP-457
GLU-458
9.1
9.4
-7.1
1.7
107.7
111.8
-42.5
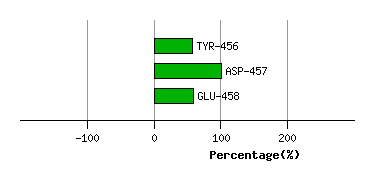
Graph shows rotational transition at bending residues and can be used
to identify hinge bending residues.
Probably only informative for interdomain rotations greater than 20 degrees