Maltose/maltodextrin Transport Atp-Binding Protein Malk
(All numbering and residues are taken from first PDB file)
![]()
![]()
Bending Residue Dihedral Analysis
Residue
iResidue
i+1Distance of hinge axis to residue i in
(A) Distance of hinge axis to residue i in
(A) Change in
(deg) Change in
(deg) Angle of psi(i) axis to hinge axis
(deg) Angle of psi(i) axis to hinge axis
(deg) Percentage Progress
GLU-30
PHE-31
7.6
7.4
9.8
1.3
77.3
87.1
29.4
PHE-31
VAL-32
4.4
4.4
1.6
-1.2
142.5
142.4
18.0
VAL-32
VAL-33
3.2
3.2
-9.6
19.8
95.7
91.4
-7.4
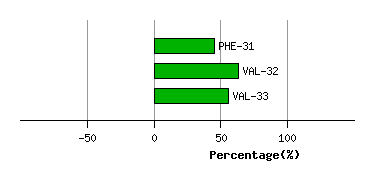
Graph shows rotational transition at bending residues and can be used
to identify hinge bending residues.
Probably only informative for interdomain rotations greater than 20 degrees
Residue
iResidue
i+1Distance of hinge axis to residue i in
(A) Distance of hinge axis to residue i in
(A) Change in
(deg) Change in
(deg) Angle of psi(i) axis to hinge axis
(deg) Angle of psi(i) axis to hinge axis
(deg) Percentage Progress
VAL-35
GLY-36
7.3
7.8
0.6
10.2
28.2
29.8
68.8
GLY-36
PRO-37
10.1
10.7
-4.9
-10.4
82.8
75.5
-10.0
PRO-37
SER-38
13.9
14.5
-14.2
10.7
92.6
92.1
-17.5
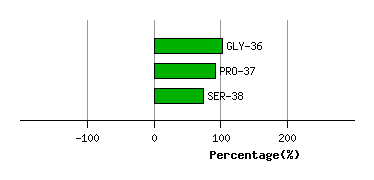
Graph shows rotational transition at bending residues and can be used
to identify hinge bending residues.
Probably only informative for interdomain rotations greater than 20 degrees
Residue
iResidue
i+1Distance of hinge axis to residue i in
(A) Distance of hinge axis to residue i in
(A) Change in
(deg) Change in
(deg) Angle of psi(i) axis to hinge axis
(deg) Angle of psi(i) axis to hinge axis
(deg) Percentage Progress
ASP-158
GLU-159
12.6
13.4
-84.0
105.8
120.0
123.3
51.3
GLU-159
PRO-160
13.2
13.1
-74.9
16.8
134.5
152.1
-368.7
PRO-160
LEU-161
15.0
13.6
-170.2
-10.2
75.5
124.3
519.9
LEU-161
SER-162
18.6
13.4
-17.7
51.8
128.7
64.7
-220.3
SER-162
ASN-163
18.1
16.1
65.8
59.8
116.5
57.8
324.7
ASN-163
LEU-164
18.1
18.8
43.8
157.1
64.3
15.1
-855.6
LEU-164
ASP-165
15.3
18.1
178.1
59.1
29.2
79.4
1253.5
ASP-165
ALA-166
17.0
19.1
160.4
8.0
53.4
105.3
203.7
ALA-166
ALA-167
18.0
17.6
-155.3
-31.8
127.9
131.9
-951.2
ALA-167
LEU-168
16.1
16.0
12.3
-7.6
102.1
85.8
-26.7
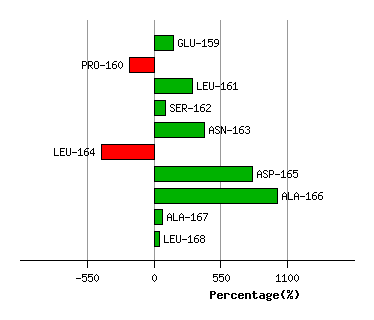
Graph shows rotational transition at bending residues and can be used
to identify hinge bending residues.
Probably only informative for interdomain rotations greater than 20 degrees
Residue
iResidue
i+1Distance of hinge axis to residue i in
(A) Distance of hinge axis to residue i in
(A) Change in
(deg) Change in
(deg) Angle of psi(i) axis to hinge axis
(deg) Angle of psi(i) axis to hinge axis
(deg) Percentage Progress
ARG-169
VAL-170
13.5
12.9
-20.3
14.0
71.2
79.7
-29.8
VAL-170
GLN-171
11.5
11.4
9.3
-28.6
118.3
130.5
54.4
GLN-171
MET-172
10.6
9.5
24.0
-22.7
47.3
68.0
-30.0
MET-172
ARG-173
10.2
9.1
11.5
5.7
73.5
52.1
94.5
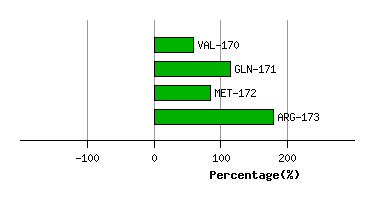
Graph shows rotational transition at bending residues and can be used
to identify hinge bending residues.
Probably only informative for interdomain rotations greater than 20 degrees
Residue
iResidue
i+1Distance of hinge axis to residue i in
(A) Distance of hinge axis to residue i in
(A) Change in
(deg) Change in
(deg) Angle of psi(i) axis to hinge axis
(deg) Angle of psi(i) axis to hinge axis
(deg) Percentage Progress
MET-187
ILE-188
8.1
8.3
-16.5
17.8
39.3
42.3
-5.0
ILE-188
TYR-189
7.2
7.5
-9.5
20.2
107.1
108.6
42.2
TYR-189
VAL-190
7.0
7.2
-3.5
-3.4
43.1
43.1
39.8
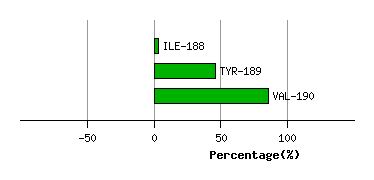
Graph shows rotational transition at bending residues and can be used
to identify hinge bending residues.
Probably only informative for interdomain rotations greater than 20 degrees
Residue
iResidue
i+1Distance of hinge axis to residue i in
(A) Distance of hinge axis to residue i in
(A) Change in
(deg) Change in
(deg) Angle of psi(i) axis to hinge axis
(deg) Angle of psi(i) axis to hinge axis
(deg) Percentage Progress
VAL-205
VAL-206
1.6
2.1
13.3
-24.0
79.1
81.7
-77.5
VAL-206
LEU-207
5.2
5.6
4.7
0.7
37.1
32.6
47.1
LEU-207
ASP-208
6.8
7.4
-22.6
46.6
112.7
109.3
105.1
ASP-208
ALA-209
9.4
10.0
-14.7
-3.7
144.0
126.7
-99.3
ALA-209
GLY-210
11.4
12.6
-38.1
70.0
101.1
110.9
55.9
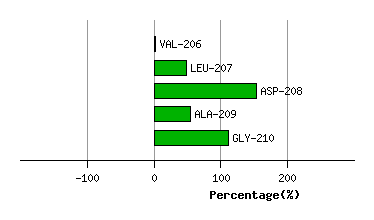
Graph shows rotational transition at bending residues and can be used
to identify hinge bending residues.
Probably only informative for interdomain rotations greater than 20 degrees
Residue
iResidue
i+1Distance of hinge axis to residue i in
(A) Distance of hinge axis to residue i in
(A) Change in
(deg) Change in
(deg) Angle of psi(i) axis to hinge axis
(deg) Angle of psi(i) axis to hinge axis
(deg) Percentage Progress
VAL-212
ALA-213
3.2
3.7
-23.8
15.5
74.3
79.4
57.7
ALA-213
GLN-214
5.2
5.5
-0.5
2.4
104.3
109.2
21.5
GLN-214
VAL-215
4.3
4.4
1.1
-3.9
37.0
39.1
8.6
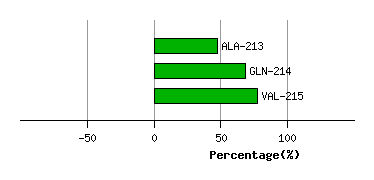
Graph shows rotational transition at bending residues and can be used
to identify hinge bending residues.
Probably only informative for interdomain rotations greater than 20 degrees