Cbl
(All numbering and residues are taken from first PDB file)
![]()
![]()
Bending Residue Dihedral Analysis
Residue
iResidue
i+1Distance of hinge axis to residue i in
(A) Distance of hinge axis to residue i in
(A) Change in
(deg) Change in
(deg) Angle of psi(i) axis to hinge axis
(deg) Angle of psi(i) axis to hinge axis
(deg) Percentage Progress
ASN-259
SER-260
4.2
4.4
10.0
4.8
67.0
63.2
18.8
SER-260
LEU-261
0.6
0.8
-26.4
14.7
58.5
65.7
-5.1
LEU-261
ALA-262
2.3
2.4
19.4
-8.9
91.5
93.9
-40.1
ALA-262
VAL-263
5.2
5.4
-19.4
17.5
132.5
136.4
21.5
VAL-263
THR-264
6.5
6.7
9.7
-1.5
35.3
25.3
18.8
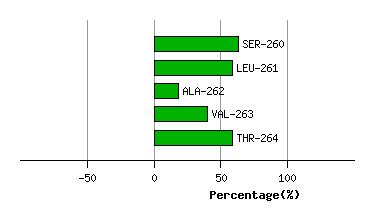
Graph shows rotational transition at bending residues and can be used
to identify hinge bending residues.
Probably only informative for interdomain rotations greater than 20 degrees
Residue
iResidue
i+1Distance of hinge axis to residue i in
(A) Distance of hinge axis to residue i in
(A) Change in
(deg) Change in
(deg) Angle of psi(i) axis to hinge axis
(deg) Angle of psi(i) axis to hinge axis
(deg) Percentage Progress
TYR-268
MET-269
9.1
9.2
0.6
-8.3
84.4
83.5
-20.8
MET-269
ALA-270
12.3
12.4
100.5
-118.0
49.9
38.5
-96.6
ALA-270
PHE-271
11.5
12.6
-71.6
119.6
138.7
121.0
185.4
PHE-271
LEU-272
13.6
14.9
-66.9
16.5
73.6
78.2
39.3
LEU-272
THR-273
16.3
16.3
-22.5
-9.2
148.1
143.9
-90.8
THR-273
TYR-274
18.2
17.8
3.5
8.0
108.4
108.4
-21.4
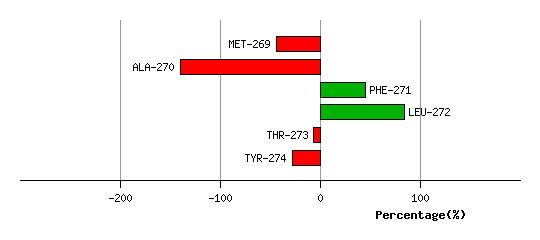
Graph shows rotational transition at bending residues and can be used
to identify hinge bending residues.
Probably only informative for interdomain rotations greater than 20 degrees
Residue
iResidue
i+1Distance of hinge axis to residue i in
(A) Distance of hinge axis to residue i in
(A) Change in
(deg) Change in
(deg) Angle of psi(i) axis to hinge axis
(deg) Angle of psi(i) axis to hinge axis
(deg) Percentage Progress
ILE-292
PHE-293
13.3
13.4
-19.1
8.5
150.1
158.4
-56.4
PHE-293
ARG-294
10.9
11.3
26.7
-24.8
69.1
67.5
-90.2
ARG-294
LEU-295
11.1
10.6
21.6
18.5
32.4
24.2
195.2
LEU-295
SER-296
10.0
9.4
-28.1
60.9
126.4
125.1
111.6
SER-296
CYS-297
12.0
11.2
25.7
-23.8
45.5
50.8
14.6
CYS-297
THR-298
13.3
13.1
-12.7
-1.8
161.4
164.7
-125.4
THR-298
ARG-299
13.2
13.0
0.2
9.0
77.5
78.0
38.9
ARG-299
LEU-300
9.8
9.8
1.9
-3.7
59.0
61.5
-23.0
ARG-299
LEU-300
9.8
9.8
1.9
-3.7
59.0
61.5
-23.0
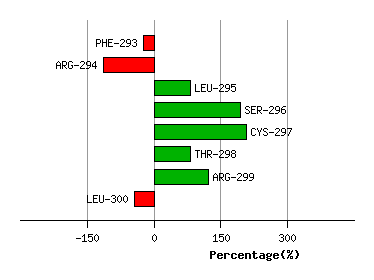
Graph shows rotational transition at bending residues and can be used
to identify hinge bending residues.
Probably only informative for interdomain rotations greater than 20 degrees
Residue
iResidue
i+1Distance of hinge axis to residue i in
(A) Distance of hinge axis to residue i in
(A) Change in
(deg) Change in
(deg) Angle of psi(i) axis to hinge axis
(deg) Angle of psi(i) axis to hinge axis
(deg) Percentage Progress
ARG-299
LEU-300
9.8
9.8
1.9
-3.7
59.0
61.5
-23.0
ARG-299
LEU-300
9.8
9.8
1.9
-3.7
59.0
61.5
-23.0
LEU-300
GLY-301
7.6
7.8
-18.0
27.8
95.9
96.0
67.5
GLY-301
GLN-302
4.2
4.5
-30.0
21.5
102.0
122.9
-51.3
GLN-302
TRP-303
6.2
6.5
23.6
2.3
34.7
40.5
155.7
TRP-303
ALA-304
7.8
8.3
-2.0
15.4
84.7
87.0
34.8
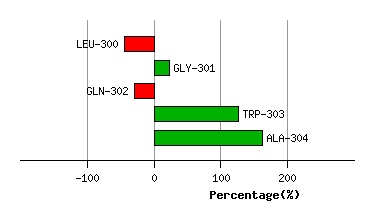
Graph shows rotational transition at bending residues and can be used
to identify hinge bending residues.
Probably only informative for interdomain rotations greater than 20 degrees