Thermosome
(All numbering and residues are taken from first PDB file)
![]()
![]()
Bending Residue Dihedral Analysis
Residue
iResidue
i+1Distance of hinge axis to residue i in
(A) Distance of hinge axis to residue i in
(A) Change in
(deg) Change in
(deg) Angle of psi(i) axis to hinge axis
(deg) Angle of psi(i) axis to hinge axis
(deg) Percentage Progress
ALA-30
LEU-31
6.9
7.0
2.8
10.3
55.2
58.6
44.5
LEU-31
GLU-32
3.7
3.9
14.8
30.2
25.4
18.9
213.1
GLU-32
ILE-33
5.3
5.5
16.5
7.9
71.9
59.8
44.4
ILE-33
LYS-34
8.0
7.3
9.9
-21.2
75.5
89.3
-22.7
LYS-34
LYS-35
11.1
11.1
-21.8
0.8
165.8
158.1
-97.8
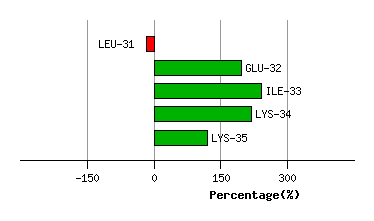
Graph shows rotational transition at bending residues and can be used
to identify hinge bending residues.
Probably only informative for interdomain rotations greater than 20 degrees
Residue
iResidue
i+1Distance of hinge axis to residue i in
(A) Distance of hinge axis to residue i in
(A) Change in
(deg) Change in
(deg) Angle of psi(i) axis to hinge axis
(deg) Angle of psi(i) axis to hinge axis
(deg) Percentage Progress
GLN-56
GLU-57
10.7
10.7
8.6
-7.8
29.4
35.9
9.8
GLU-57
THR-58
8.7
8.5
14.3
-2.7
69.2
71.4
41.8
THR-58
ASN-59
5.6
5.8
3.5
-6.2
67.9
53.2
-11.6
ASN-59
THR-60
8.7
8.9
1.0
3.6
29.5
32.4
5.1
THR-60
PHE-61
10.2
9.9
4.6
-9.3
44.8
45.7
-12.7
PHE-61
LYS-62
6.8
6.5
2.1
4.6
74.2
64.7
35.1
LYS-62
GLN-63
6.7
6.5
-3.1
0.7
125.8
132.3
-20.0
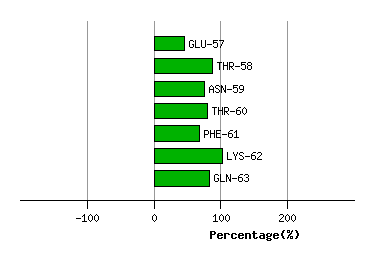
Graph shows rotational transition at bending residues and can be used
to identify hinge bending residues.
Probably only informative for interdomain rotations greater than 20 degrees
Residue
iResidue
i+1Distance of hinge axis to residue i in
(A) Distance of hinge axis to residue i in
(A) Change in
(deg) Change in
(deg) Angle of psi(i) axis to hinge axis
(deg) Angle of psi(i) axis to hinge axis
(deg) Percentage Progress
GLY-81
ILE-82
7.3
7.6
7.6
-7.3
70.8
73.9
-8.6
ILE-82
ASP-83
4.2
4.3
6.1
18.3
25.0
17.4
125.9
ASP-83
ASP-84
4.4
4.0
-29.4
7.1
102.7
97.9
-33.7
ASP-84
VAL-85
5.2
5.5
-3.0
-10.3
80.2
75.0
4.2
ASP-84
VAL-85
5.2
5.5
-3.0
-10.3
80.2
75.0
4.2
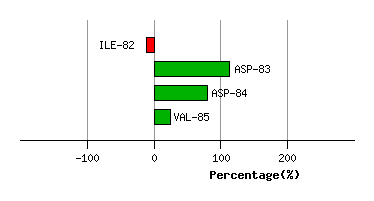
Graph shows rotational transition at bending residues and can be used
to identify hinge bending residues.
Probably only informative for interdomain rotations greater than 20 degrees
Residue
iResidue
i+1Distance of hinge axis to residue i in
(A) Distance of hinge axis to residue i in
(A) Change in
(deg) Change in
(deg) Angle of psi(i) axis to hinge axis
(deg) Angle of psi(i) axis to hinge axis
(deg) Percentage Progress
ASP-84
VAL-85
5.2
5.5
-3.0
-10.3
80.2
75.0
4.2
ASP-84
VAL-85
5.2
5.5
-3.0
-10.3
80.2
75.0
4.2
VAL-85
ALA-86
2.8
3.6
7.8
9.1
28.2
36.6
79.8
ALA-86
GLN-87
2.3
2.2
-8.1
4.9
115.6
125.9
-27.1
GLN-87
HIS-88
5.6
5.1
11.5
-8.5
105.7
109.3
12.5
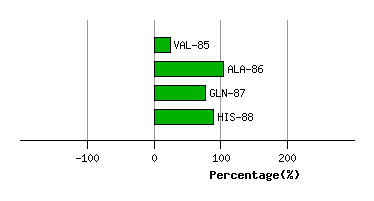
Graph shows rotational transition at bending residues and can be used
to identify hinge bending residues.
Probably only informative for interdomain rotations greater than 20 degrees