DNA Polymerase III Alpha Subunit
(All numbering and residues are taken from first PDB file)
![]()
![]()
Bending Residue Dihedral Analysis
Residue
iResidue
i+1Distance of hinge axis to residue i in
(A) Distance of hinge axis to residue i in
(A) Change in
(deg) Change in
(deg) Angle of psi(i) axis to hinge axis
(deg) Angle of psi(i) axis to hinge axis
(deg) Percentage Progress
ASP-290
TYR-291
12.6
12.4
2.8
-3.9
39.0
36.0
-34.3
TYR-291
LEU-292
11.7
11.8
5.0
7.3
34.6
32.9
174.3
LEU-292
VAL-293
9.7
9.6
0.0
-16.3
68.9
65.7
-157.9
VAL-293
LYS-294
12.9
12.9
9.6
-0.5
55.7
64.2
103.9
LYS-294
ARG-295
14.8
15.0
16.6
-28.7
24.1
22.8
-183.2
LYS-294
ARG-295
14.8
15.0
16.6
-28.7
24.1
22.8
-183.2
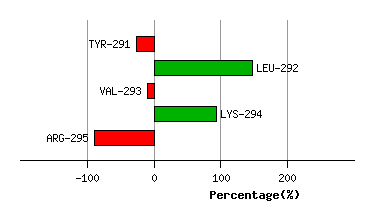
Graph shows rotational transition at bending residues and can be used
to identify hinge bending residues.
Probably only informative for interdomain rotations greater than 20 degrees
Residue
iResidue
i+1Distance of hinge axis to residue i in
(A) Distance of hinge axis to residue i in
(A) Change in
(deg) Change in
(deg) Angle of psi(i) axis to hinge axis
(deg) Angle of psi(i) axis to hinge axis
(deg) Percentage Progress
LYS-294
ARG-295
14.8
15.0
16.6
-28.7
24.1
22.8
-183.2
LYS-294
ARG-295
14.8
15.0
16.6
-28.7
24.1
22.8
-183.2
ARG-295
ALA-296
12.6
13.0
0.6
13.5
49.4
48.2
233.0
ALA-296
LYS-297
12.0
11.9
1.8
-6.8
68.7
69.3
-57.2
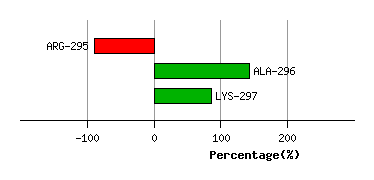
Graph shows rotational transition at bending residues and can be used
to identify hinge bending residues.
Probably only informative for interdomain rotations greater than 20 degrees
Residue
iResidue
i+1Distance of hinge axis to residue i in
(A) Distance of hinge axis to residue i in
(A) Change in
(deg) Change in
(deg) Angle of psi(i) axis to hinge axis
(deg) Angle of psi(i) axis to hinge axis
(deg) Percentage Progress
GLU-323
ARG-324
20.6
20.8
-16.5
-3.9
88.2
96.9
-203.7
ARG-324
LEU-325
17.6
17.7
6.9
-1.3
58.5
60.9
100.7
LEU-325
GLU-326
15.4
15.3
11.1
20.6
7.3
8.0
398.9
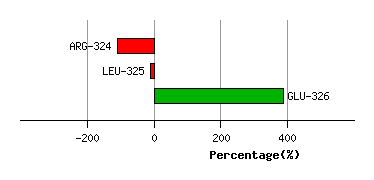
Graph shows rotational transition at bending residues and can be used
to identify hinge bending residues.
Probably only informative for interdomain rotations greater than 20 degrees
Residue
iResidue
i+1Distance of hinge axis to residue i in
(A) Distance of hinge axis to residue i in
(A) Change in
(deg) Change in
(deg) Angle of psi(i) axis to hinge axis
(deg) Angle of psi(i) axis to hinge axis
(deg) Percentage Progress
GLU-328
LEU-329
13.4
13.0
-1.0
2.2
39.2
42.0
19.8
LEU-329
GLN-330
12.4
12.1
-13.3
4.0
25.6
26.3
143.8
GLN-330
VAL-331
14.1
13.8
13.4
-8.7
102.5
97.0
-114.9
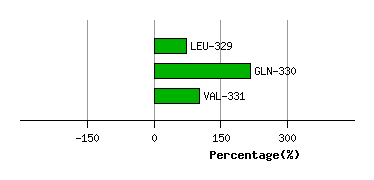
Graph shows rotational transition at bending residues and can be used
to identify hinge bending residues.
Probably only informative for interdomain rotations greater than 20 degrees
Residue
iResidue
i+1Distance of hinge axis to residue i in
(A) Distance of hinge axis to residue i in
(A) Change in
(deg) Change in
(deg) Angle of psi(i) axis to hinge axis
(deg) Angle of psi(i) axis to hinge axis
(deg) Percentage Progress
ILE-332
ASN-333
9.1
8.7
-4.8
9.8
154.7
157.8
31.1
ASN-333
GLN-334
9.3
8.9
-7.9
16.2
141.4
137.3
132.0
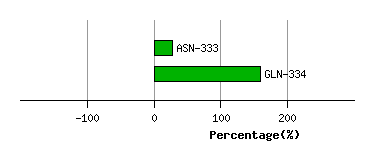
Graph shows rotational transition at bending residues and can be used
to identify hinge bending residues.
Probably only informative for interdomain rotations greater than 20 degrees
Residue
iResidue
i+1Distance of hinge axis to residue i in
(A) Distance of hinge axis to residue i in
(A) Change in
(deg) Change in
(deg) Angle of psi(i) axis to hinge axis
(deg) Angle of psi(i) axis to hinge axis
(deg) Percentage Progress
VAL-370
ALA-371
9.4
9.5
3.2
-7.1
65.3
63.2
7.4
ALA-371
TYR-372
6.0
6.2
5.7
-4.8
37.8
36.9
10.8
TYR-372
ALA-373
7.9
8.1
2.7
0.1
104.4
105.3
73.3
ALA-373
LEU-374
10.3
10.5
-0.8
1.8
103.6
102.8
25.4
ALA-373
LEU-374
10.3
10.5
-0.8
1.8
103.6
102.8
25.4
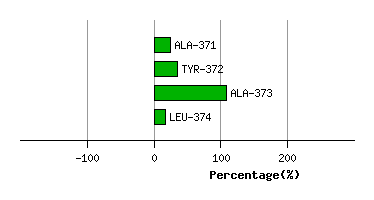
Graph shows rotational transition at bending residues and can be used
to identify hinge bending residues.
Probably only informative for interdomain rotations greater than 20 degrees
Residue
iResidue
i+1Distance of hinge axis to residue i in
(A) Distance of hinge axis to residue i in
(A) Change in
(deg) Change in
(deg) Angle of psi(i) axis to hinge axis
(deg) Angle of psi(i) axis to hinge axis
(deg) Percentage Progress
ALA-373
LEU-374
10.3
10.5
-0.8
1.8
103.6
102.8
25.4
ALA-373
LEU-374
10.3
10.5
-0.8
1.8
103.6
102.8
25.4
LEU-374
LYS-375
7.9
8.0
-2.7
-6.5
43.7
39.4
120.4
LYS-375
ILE-376
6.6
6.8
12.2
-7.8
86.5
83.5
-50.0
ILE-376
THR-377
3.0
3.2
5.1
3.0
36.1
37.9
46.7
ILE-376
THR-377
3.0
3.2
5.1
3.0
36.1
37.9
46.7
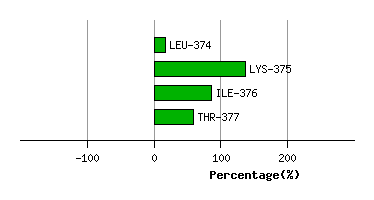
Graph shows rotational transition at bending residues and can be used
to identify hinge bending residues.
Probably only informative for interdomain rotations greater than 20 degrees
Residue
iResidue
i+1Distance of hinge axis to residue i in
(A) Distance of hinge axis to residue i in
(A) Change in
(deg) Change in
(deg) Angle of psi(i) axis to hinge axis
(deg) Angle of psi(i) axis to hinge axis
(deg) Percentage Progress
ILE-376
THR-377
3.0
3.2
5.1
3.0
36.1
37.9
46.7
ILE-376
THR-377
3.0
3.2
5.1
3.0
36.1
37.9
46.7
THR-377
ASP-378
3.6
3.8
-5.5
-2.9
126.4
127.7
-88.1
ASP-378
LEU-379
5.5
5.7
1.3
11.4
63.1
58.8
131.2
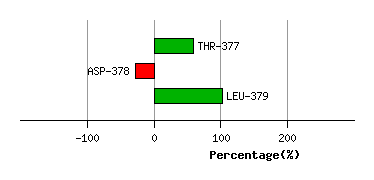
Graph shows rotational transition at bending residues and can be used
to identify hinge bending residues.
Probably only informative for interdomain rotations greater than 20 degrees
Residue
iResidue
i+1Distance of hinge axis to residue i in
(A) Distance of hinge axis to residue i in
(A) Change in
(deg) Change in
(deg) Angle of psi(i) axis to hinge axis
(deg) Angle of psi(i) axis to hinge axis
(deg) Percentage Progress
ARG-396
VAL-397
17.5
17.2
-12.6
15.9
117.1
105.5
-43.5
VAL-397
SER-398
15.1
14.9
11.2
-28.0
142.1
144.0
234.4
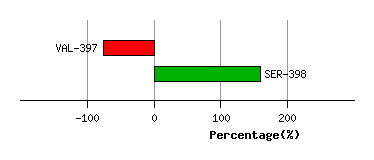
Graph shows rotational transition at bending residues and can be used
to identify hinge bending residues.
Probably only informative for interdomain rotations greater than 20 degrees
Residue
iResidue
i+1Distance of hinge axis to residue i in
(A) Distance of hinge axis to residue i in
(A) Change in
(deg) Change in
(deg) Angle of psi(i) axis to hinge axis
(deg) Angle of psi(i) axis to hinge axis
(deg) Percentage Progress
ILE-586
ALA-587
7.0
7.3
22.8
-25.2
120.1
117.8
-78.7
ALA-587
ALA-588
6.8
7.7
-2.0
11.6
106.9
110.6
53.2
ALA-588
ILE-589
10.2
10.8
-9.6
23.1
153.8
148.7
119.9
ILE-589
PRO-590
8.9
8.8
-21.4
-7.5
88.7
85.1
-98.1
PRO-590
LEU-591
10.6
10.8
-6.6
5.1
98.1
104.8
-15.9
LEU-591
ASP-592
9.5
9.6
6.7
-4.8
138.4
133.8
-2.3
LEU-591
ASP-592
9.5
9.6
6.7
-4.8
138.4
133.8
-2.3
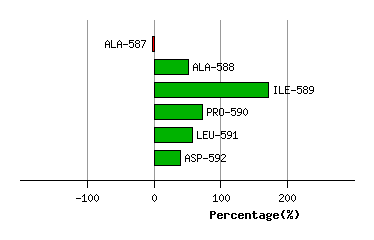
Graph shows rotational transition at bending residues and can be used
to identify hinge bending residues.
Probably only informative for interdomain rotations greater than 20 degrees
Residue
iResidue
i+1Distance of hinge axis to residue i in
(A) Distance of hinge axis to residue i in
(A) Change in
(deg) Change in
(deg) Angle of psi(i) axis to hinge axis
(deg) Angle of psi(i) axis to hinge axis
(deg) Percentage Progress
LEU-591
ASP-592
9.5
9.6
6.7
-4.8
138.4
133.8
-2.3
LEU-591
ASP-592
9.5
9.6
6.7
-4.8
138.4
133.8
-2.3
ASP-592
ASP-593
11.6
12.0
40.0
-46.0
149.5
146.4
113.4
ASP-593
LYS-594
9.7
10.2
-18.0
19.9
38.6
34.1
-100.7
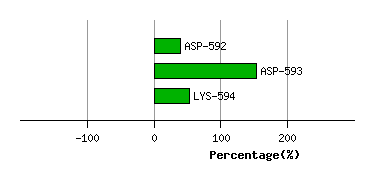
Graph shows rotational transition at bending residues and can be used
to identify hinge bending residues.
Probably only informative for interdomain rotations greater than 20 degrees
Residue
iResidue
i+1Distance of hinge axis to residue i in
(A) Distance of hinge axis to residue i in
(A) Change in
(deg) Change in
(deg) Angle of psi(i) axis to hinge axis
(deg) Angle of psi(i) axis to hinge axis
(deg) Percentage Progress
LEU-623
GLN-624
17.8
18.3
18.2
-5.6
74.5
84.6
13.7
GLN-624
PRO-625
15.1
15.2
24.3
-8.3
140.0
138.4
-109.5
PRO-625
ASP-626
13.8
14.2
2.4
20.5
78.2
77.2
107.6
ASP-626
CYS-627
13.4
14.1
-17.4
19.3
38.9
39.5
-77.1
CYS-627
PHE-628
13.2
13.6
7.1
-4.6
132.7
129.7
27.5
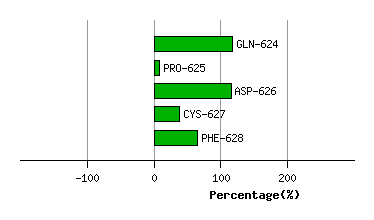
Graph shows rotational transition at bending residues and can be used
to identify hinge bending residues.
Probably only informative for interdomain rotations greater than 20 degrees
Residue
iResidue
i+1Distance of hinge axis to residue i in
(A) Distance of hinge axis to residue i in
(A) Change in
(deg) Change in
(deg) Angle of psi(i) axis to hinge axis
(deg) Angle of psi(i) axis to hinge axis
(deg) Percentage Progress
ILE-632
ALA-633
12.4
12.3
-17.2
17.4
83.7
82.4
24.4
ALA-633
LEU-634
15.7
15.8
1.0
6.5
114.6
117.1
-51.4
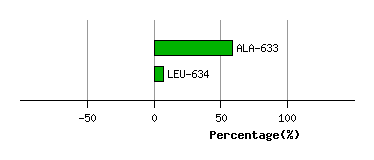
Graph shows rotational transition at bending residues and can be used
to identify hinge bending residues.
Probably only informative for interdomain rotations greater than 20 degrees
Residue
iResidue
i+1Distance of hinge axis to residue i in
(A) Distance of hinge axis to residue i in
(A) Change in
(deg) Change in
(deg) Angle of psi(i) axis to hinge axis
(deg) Angle of psi(i) axis to hinge axis
(deg) Percentage Progress
ASP-649
ASN-650
26.2
26.7
-8.8
0.1
76.8
82.2
-62.8
ASN-650
PHE-651
27.6
28.0
21.4
-17.8
97.4
94.6
-18.8
PHE-651
ILE-652
24.3
24.5
-1.3
-2.0
148.2
150.5
70.4
ILE-652
ASP-653
22.8
22.9
6.9
-1.7
60.0
55.9
16.9
ASP-653
ARG-654
26.1
26.0
9.7
-5.9
112.5
118.7
-209.8
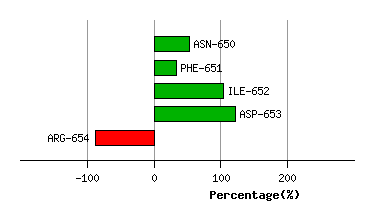
Graph shows rotational transition at bending residues and can be used
to identify hinge bending residues.
Probably only informative for interdomain rotations greater than 20 degrees
Residue
iResidue
i+1Distance of hinge axis to residue i in
(A) Distance of hinge axis to residue i in
(A) Change in
(deg) Change in
(deg) Angle of psi(i) axis to hinge axis
(deg) Angle of psi(i) axis to hinge axis
(deg) Percentage Progress
TYR-663
PRO-664
31.3
31.0
5.8
-0.9
138.8
136.3
-97.1
PRO-664
ASP-665
31.1
31.2
-35.4
41.4
133.7
133.5
-47.4
ASP-665
VAL-666
34.4
34.2
5.9
0.2
72.9
54.7
68.0
VAL-666
GLN-667
37.2
36.4
1.9
-6.5
130.9
114.3
150.7
GLN-667
TRP-668
39.8
39.4
-4.7
20.7
30.7
30.8
-259.1
TRP-668
GLN-669
37.6
37.8
14.5
-3.0
88.1
90.8
54.0
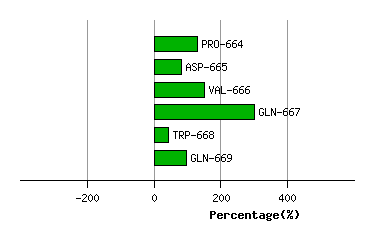
Graph shows rotational transition at bending residues and can be used
to identify hinge bending residues.
Probably only informative for interdomain rotations greater than 20 degrees
Residue
iResidue
i+1Distance of hinge axis to residue i in
(A) Distance of hinge axis to residue i in
(A) Change in
(deg) Change in
(deg) Angle of psi(i) axis to hinge axis
(deg) Angle of psi(i) axis to hinge axis
(deg) Percentage Progress
ALA-763
TYR-764
6.1
6.3
-10.3
-4.0
44.4
34.3
87.1
TYR-764
ALA-765
7.0
6.9
1.5
11.5
151.2
150.8
-112.3
ALA-765
LEU-766
7.4
7.3
-9.8
0.3
79.3
79.4
110.2
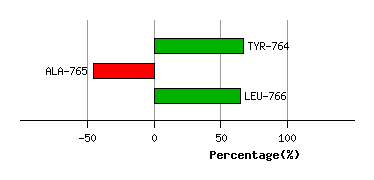
Graph shows rotational transition at bending residues and can be used
to identify hinge bending residues.
Probably only informative for interdomain rotations greater than 20 degrees