Ribokinase
(All numbering and residues are taken from first PDB file)
![]()
![]()
Bending Residue Dihedral Analysis
Residue
iResidue
i+1Distance of hinge axis to residue i in
(A) Distance of hinge axis to residue i in
(A) Change in
(deg) Change in
(deg) Angle of psi(i) axis to hinge axis
(deg) Angle of psi(i) axis to hinge axis
(deg) Percentage Progress
GLY-22
SER-23
9.4
9.4
4.0
-2.4
73.8
74.2
14.8
SER-23
CYS-24
5.8
5.8
-5.6
8.4
157.2
155.2
-3.3
CYS-24
MET-25
3.2
3.1
-5.2
5.3
69.9
70.3
84.7
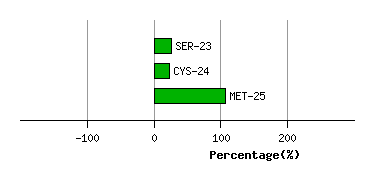
Graph shows rotational transition at bending residues and can be used
to identify hinge bending residues.
Probably only informative for interdomain rotations greater than 20 degrees
Residue
iResidue
i+1Distance of hinge axis to residue i in
(A) Distance of hinge axis to residue i in
(A) Change in
(deg) Change in
(deg) Angle of psi(i) axis to hinge axis
(deg) Angle of psi(i) axis to hinge axis
(deg) Percentage Progress
PHE-51
GLY-52
3.6
3.6
-4.6
4.5
117.0
118.9
27.0
GLY-52
GLY-53
5.3
5.4
-1.2
-0.4
128.6
130.9
-50.6
GLY-53
LYS-54
5.6
5.8
1.7
-3.9
103.2
104.3
54.3
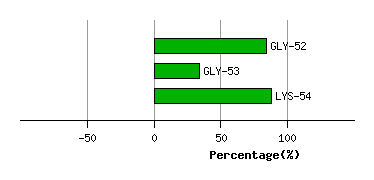
Graph shows rotational transition at bending residues and can be used
to identify hinge bending residues.
Probably only informative for interdomain rotations greater than 20 degrees
Residue
iResidue
i+1Distance of hinge axis to residue i in
(A) Distance of hinge axis to residue i in
(A) Change in
(deg) Change in
(deg) Angle of psi(i) axis to hinge axis
(deg) Angle of psi(i) axis to hinge axis
(deg) Percentage Progress
GLY-81
ASN-82
6.9
6.6
1.3
2.5
28.7
28.7
36.9
ASN-82
ASP-83
8.8
8.5
0.8
-6.7
48.6
47.5
-27.4
ASP-83
TYR-84
5.8
5.6
1.4
0.4
100.0
100.4
10.2
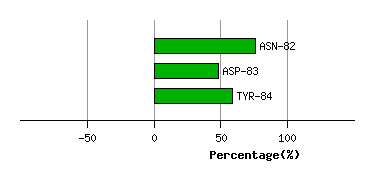
Graph shows rotational transition at bending residues and can be used
to identify hinge bending residues.
Probably only informative for interdomain rotations greater than 20 degrees
Residue
iResidue
i+1Distance of hinge axis to residue i in
(A) Distance of hinge axis to residue i in
(A) Change in
(deg) Change in
(deg) Angle of psi(i) axis to hinge axis
(deg) Angle of psi(i) axis to hinge axis
(deg) Percentage Progress
ASN-87
LEU-88
2.8
2.9
-2.9
-0.8
90.7
90.8
70.3
LEU-88
LYS-89
6.2
6.3
0.4
1.1
143.7
142.8
-28.9
LYS-89
GLN-90
8.0
8.2
-4.0
10.2
36.1
35.2
-68.9
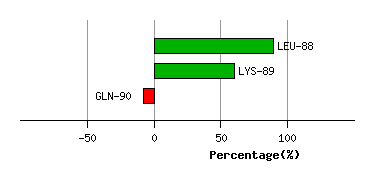
Graph shows rotational transition at bending residues and can be used
to identify hinge bending residues.
Probably only informative for interdomain rotations greater than 20 degrees
Residue
iResidue
i+1Distance of hinge axis to residue i in
(A) Distance of hinge axis to residue i in
(A) Change in
(deg) Change in
(deg) Angle of psi(i) axis to hinge axis
(deg) Angle of psi(i) axis to hinge axis
(deg) Percentage Progress
THR-106
GLY-107
5.0
4.8
-1.0
-7.1
66.4
65.1
-19.6
GLY-107
THR-108
2.0
2.1
13.2
-3.5
53.2
53.7
54.7
THR-108
ALA-109
4.9
5.0
-0.3
-7.5
73.3
74.7
61.8
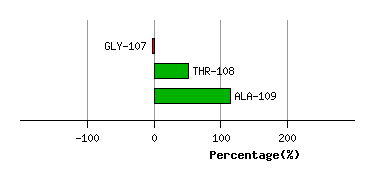
Graph shows rotational transition at bending residues and can be used
to identify hinge bending residues.
Probably only informative for interdomain rotations greater than 20 degrees
Residue
iResidue
i+1Distance of hinge axis to residue i in
(A) Distance of hinge axis to residue i in
(A) Change in
(deg) Change in
(deg) Angle of psi(i) axis to hinge axis
(deg) Angle of psi(i) axis to hinge axis
(deg) Percentage Progress
ILE-123
VAL-124
7.3
7.3
-1.8
4.8
130.1
129.5
43.1
VAL-124
ALA-125
4.9
4.9
-3.2
-0.9
69.8
69.5
32.6
ALA-125
GLY-126
1.2
1.3
5.5
-5.5
107.2
107.0
16.4
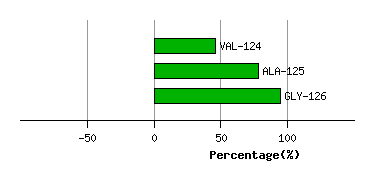
Graph shows rotational transition at bending residues and can be used
to identify hinge bending residues.
Probably only informative for interdomain rotations greater than 20 degrees