Mycoplasma Arthritidis Mitogen
(All numbering and residues are taken from first PDB file)
![]()
![]()
Bending Residue Dihedral Analysis
Residue
iResidue
i+1Distance of hinge axis to residue i in
(A) Distance of hinge axis to residue i in
(A) Change in
(deg) Change in
(deg) Angle of psi(i) axis to hinge axis
(deg) Angle of psi(i) axis to hinge axis
(deg) Percentage Progress
ILE-62
VAL-63
5.2
5.1
0.8
-7.7
43.1
40.5
-95.4
VAL-63
ASN-64
8.3
8.0
16.1
-9.6
28.8
34.5
90.7
ASN-64
ASP-65
8.1
7.7
15.1
-11.2
60.3
57.0
75.2
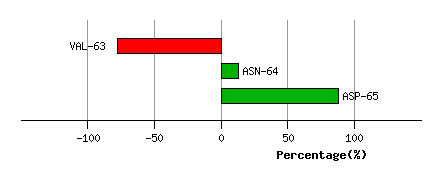
Graph shows rotational transition at bending residues and can be used
to identify hinge bending residues.
Probably only informative for interdomain rotations greater than 20 degrees
Residue
iResidue
i+1Distance of hinge axis to residue i in
(A) Distance of hinge axis to residue i in
(A) Change in
(deg) Change in
(deg) Angle of psi(i) axis to hinge axis
(deg) Angle of psi(i) axis to hinge axis
(deg) Percentage Progress
TYR-66
ASN-67
4.8
4.7
16.1
-10.2
100.1
98.5
-11.1
ASN-67
GLY-68
8.4
8.2
2.4
-15.1
132.7
131.4
83.5
GLY-68
LEU-69
7.8
7.9
21.4
-12.7
63.5
64.0
53.0
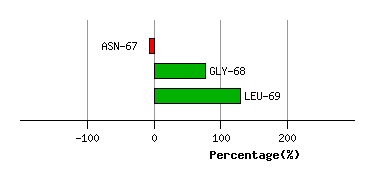
Graph shows rotational transition at bending residues and can be used
to identify hinge bending residues.
Probably only informative for interdomain rotations greater than 20 degrees
Residue
iResidue
i+1Distance of hinge axis to residue i in
(A) Distance of hinge axis to residue i in
(A) Change in
(deg) Change in
(deg) Angle of psi(i) axis to hinge axis
(deg) Angle of psi(i) axis to hinge axis
(deg) Percentage Progress
SER-123
GLN-124
11.7
11.7
-32.3
28.7
101.7
108.1
-28.0
GLN-124
ASN-125
14.0
14.2
-1.2
10.7
158.1
152.5
64.5
ASN-125
LYS-126
12.6
12.8
-3.2
8.1
126.0
135.1
61.5
LYS-126
ASN-127
12.7
13.2
-4.1
-11.1
140.8
140.6
-105.9
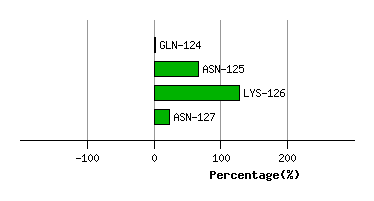
Graph shows rotational transition at bending residues and can be used
to identify hinge bending residues.
Probably only informative for interdomain rotations greater than 20 degrees
Residue
iResidue
i+1Distance of hinge axis to residue i in
(A) Distance of hinge axis to residue i in
(A) Change in
(deg) Change in
(deg) Angle of psi(i) axis to hinge axis
(deg) Angle of psi(i) axis to hinge axis
(deg) Percentage Progress
LEU-138
THR-139
4.3
4.6
-12.5
15.4
104.6
104.1
43.5
THR-139
LYS-140
6.3
6.2
-1.4
-0.4
84.6
83.4
-10.8
LYS-140
GLU-141
9.3
9.3
-2.7
-0.2
13.9
14.1
28.6
GLU-141
MET-142
8.9
9.0
-13.6
11.1
77.2
75.1
27.2
MET-142
LYS-143
9.3
9.0
-2.5
1.4
106.5
110.1
-25.5
LYS-143
ILE-144
12.5
12.0
-16.9
21.8
42.2
46.4
-55.1
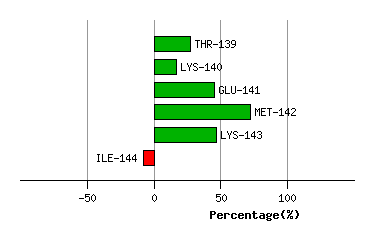
Graph shows rotational transition at bending residues and can be used
to identify hinge bending residues.
Probably only informative for interdomain rotations greater than 20 degrees
Residue
iResidue
i+1Distance of hinge axis to residue i in
(A) Distance of hinge axis to residue i in
(A) Change in
(deg) Change in
(deg) Angle of psi(i) axis to hinge axis
(deg) Angle of psi(i) axis to hinge axis
(deg) Percentage Progress
GLU-199
LEU-200
17.6
17.4
12.1
22.1
103.0
110.4
-207.6
LEU-200
LYS-201
14.5
14.5
-16.5
-16.4
103.9
112.0
-179.0
LYS-201
THR-202
13.8
12.6
26.1
25.5
40.0
32.3
514.0
THR-202
THR-203
12.3
12.1
-65.3
50.5
101.4
79.9
-84.0
THR-203
SER-204
11.3
11.3
-23.3
-6.5
91.7
97.0
-65.7
SER-204
ASP-205
7.6
7.5
-13.9
22.5
76.9
74.8
-23.9
ASP-205
PHE-206
5.0
5.1
-15.6
14.8
7.8
8.3
0.7
PHE-206
ALA-207
5.1
4.8
-6.8
9.0
72.9
72.1
7.3
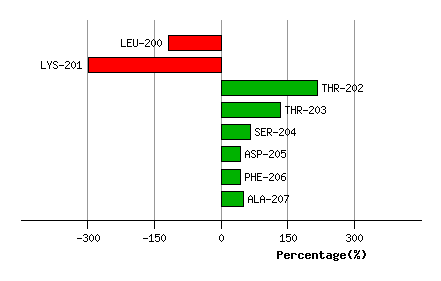
Graph shows rotational transition at bending residues and can be used
to identify hinge bending residues.
Probably only informative for interdomain rotations greater than 20 degrees