Eukaryotic Translation Initiation Factor 5
(All numbering and residues are taken from first PDB file)
![]()
![]()
Bending Residue Dihedral Analysis
Residue
iResidue
i+1Distance of hinge axis to residue i in
(A) Distance of hinge axis to residue i in
(A) Change in
(deg) Change in
(deg) Angle of psi(i) axis to hinge axis
(deg) Angle of psi(i) axis to hinge axis
(deg) Percentage Progress
ASN-323
PHE-324
6.3
6.4
-4.0
3.5
125.5
122.9
-23.5
PHE-324
MET-325
3.9
4.0
0.5
-1.9
121.2
124.8
34.3
MET-325
GLY-326
1.0
1.1
0.3
0.9
135.5
134.7
-5.2
GLY-326
GLY-327
3.4
3.8
-1.2
1.2
114.0
113.3
-8.1
GLY-327
ILE-328
5.6
5.9
1.7
-2.4
80.9
84.5
37.5
ILE-328
GLU-329
4.5
4.8
5.8
-1.8
150.2
153.7
-33.7
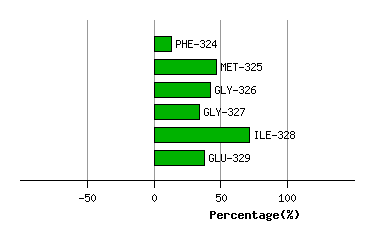
Graph shows rotational transition at bending residues and can be used
to identify hinge bending residues.
Probably only informative for interdomain rotations greater than 20 degrees
Residue
iResidue
i+1Distance of hinge axis to residue i in
(A) Distance of hinge axis to residue i in
(A) Change in
(deg) Change in
(deg) Angle of psi(i) axis to hinge axis
(deg) Angle of psi(i) axis to hinge axis
(deg) Percentage Progress
ILE-355
ILE-356
5.2
5.1
9.1
-5.7
22.9
25.3
33.4
ILE-356
SER-357
6.2
6.0
7.5
-1.3
81.8
77.7
6.0
SER-357
GLU-358
9.9
9.6
5.2
4.2
43.4
45.8
169.4
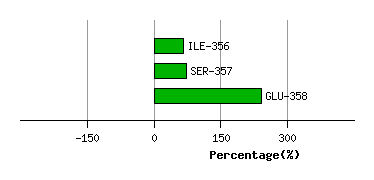
Graph shows rotational transition at bending residues and can be used
to identify hinge bending residues.
Probably only informative for interdomain rotations greater than 20 degrees
Residue
iResidue
i+1Distance of hinge axis to residue i in
(A) Distance of hinge axis to residue i in
(A) Change in
(deg) Change in
(deg) Angle of psi(i) axis to hinge axis
(deg) Angle of psi(i) axis to hinge axis
(deg) Percentage Progress
GLU-360
ILE-361
8.5
7.9
-4.4
-3.1
77.4
78.8
4.7
ILE-361
MET-362
7.7
7.3
-0.3
-0.1
26.5
27.4
13.4
MET-362
ARG-363
10.2
9.7
-0.2
2.3
41.0
42.3
3.6
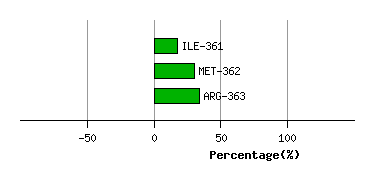
Graph shows rotational transition at bending residues and can be used
to identify hinge bending residues.
Probably only informative for interdomain rotations greater than 20 degrees