Nitrogenase Molybdenum-Iron Protein Alpha Chain
(All numbering and residues are taken from first PDB file)
![]()
![]()
Bending Residue Dihedral Analysis
Residue
iResidue
i+1Distance of hinge axis to residue i in
(A) Distance of hinge axis to residue i in
(A) Change in
(deg) Change in
(deg) Angle of psi(i) axis to hinge axis
(deg) Angle of psi(i) axis to hinge axis
(deg) Percentage Progress
LYS-349
ARG-350
4.4
4.5
14.2
-6.2
113.9
117.3
-23.0
ARG-350
VAL-351
4.1
4.1
19.6
-24.8
124.0
122.1
7.3
VAL-351
MET-352
2.4
2.3
9.7
-8.9
122.6
133.7
40.4
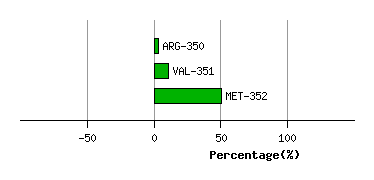
Graph shows rotational transition at bending residues and can be used
to identify hinge bending residues.
Probably only informative for interdomain rotations greater than 20 degrees
Residue
iResidue
i+1Distance of hinge axis to residue i in
(A) Distance of hinge axis to residue i in
(A) Change in
(deg) Change in
(deg) Angle of psi(i) axis to hinge axis
(deg) Angle of psi(i) axis to hinge axis
(deg) Percentage Progress
GLY-356
GLY-357
15.3
16.4
140.4
118.0
130.5
99.8
79.2
GLY-357
LEU-358
15.6
18.8
161.2
-32.8
102.1
161.8
-190.7
LEU-358
ARG-359
13.4
18.0
-49.2
98.5
29.7
69.8
539.7
ARG-359
PRO-360
13.0
14.6
-172.8
-7.0
81.5
102.3
-36.5
PRO-360
ARG-361
13.8
12.6
-172.6
-42.3
59.1
51.7
-136.9
ARG-361
HIS-362
17.4
14.2
-7.5
84.8
9.5
28.7
-157.9
HIS-362
VAL-363
16.0
14.8
130.2
-11.8
97.9
119.6
-52.7
VAL-363
ILE-364
13.1
11.2
-127.2
11.5
120.7
76.5
-157.1
ILE-364
GLY-365
11.5
9.9
-1.7
167.1
49.1
14.8
390.1
GLY-365
ALA-366
10.4
10.3
71.7
-6.6
108.6
110.8
-55.7
ALA-366
TYR-367
7.7
8.3
-3.5
-4.3
107.6
106.3
-25.6
TYR-367
GLU-368
5.0
5.3
-0.1
2.3
51.8
54.4
2.5
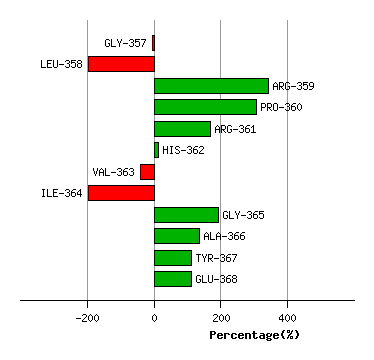
Graph shows rotational transition at bending residues and can be used
to identify hinge bending residues.
Probably only informative for interdomain rotations greater than 20 degrees
Residue
iResidue
i+1Distance of hinge axis to residue i in
(A) Distance of hinge axis to residue i in
(A) Change in
(deg) Change in
(deg) Angle of psi(i) axis to hinge axis
(deg) Angle of psi(i) axis to hinge axis
(deg) Percentage Progress
GLU-373
VAL-374
6.1
6.2
21.1
0.8
139.8
151.3
-33.0
VAL-374
VAL-375
6.8
6.8
-17.0
15.2
49.7
51.0
-20.9
VAL-375
GLY-376
8.4
7.9
179.4
-38.4
128.9
150.3
-206.0
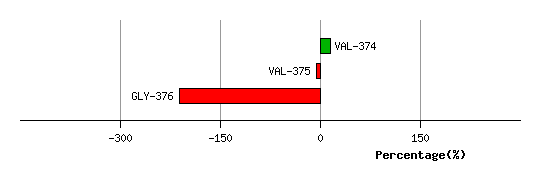
Graph shows rotational transition at bending residues and can be used
to identify hinge bending residues.
Probably only informative for interdomain rotations greater than 20 degrees
Residue
iResidue
i+1Distance of hinge axis to residue i in
(A) Distance of hinge axis to residue i in
(A) Change in
(deg) Change in
(deg) Angle of psi(i) axis to hinge axis
(deg) Angle of psi(i) axis to hinge axis
(deg) Percentage Progress
GLU-410
GLU-411
2.3
0.8
6.1
1.8
100.0
88.4
8.8
GLU-411
PHE-412
5.2
3.9
-1.2
-14.7
32.5
31.9
40.0
PHE-412
VAL-413
6.8
5.4
7.2
0.1
141.7
131.0
-15.7
VAL-413
LYS-414
4.2
2.8
-5.1
3.6
90.8
102.3
-0.8
LYS-414
ARG-415
6.0
5.3
-0.8
-2.5
69.8
70.5
3.5
ARG-415
ILE-416
9.1
8.1
-18.7
14.9
15.1
7.2
11.0
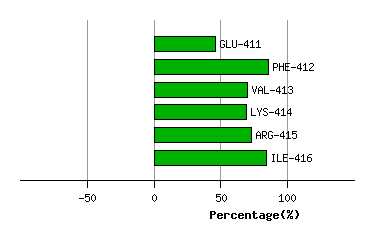
Graph shows rotational transition at bending residues and can be used
to identify hinge bending residues.
Probably only informative for interdomain rotations greater than 20 degrees
Residue
iResidue
i+1Distance of hinge axis to residue i in
(A) Distance of hinge axis to residue i in
(A) Change in
(deg) Change in
(deg) Angle of psi(i) axis to hinge axis
(deg) Angle of psi(i) axis to hinge axis
(deg) Percentage Progress
PRO-418
ASP-419
4.0
3.8
-23.5
20.9
111.0
111.1
-9.0
ASP-419
LEU-420
3.6
4.2
-0.4
19.1
79.7
89.2
-4.6
LEU-420
ILE-421
2.0
2.4
-4.4
-24.4
73.1
55.5
41.1
ILE-421
GLY-422
3.2
3.2
17.7
-38.3
55.5
68.9
-32.9
GLY-422
SER-423
5.9
6.6
131.1
17.5
115.5
135.1
-181.9
SER-423
GLY-424
8.7
9.0
24.0
173.6
156.9
98.0
320.2
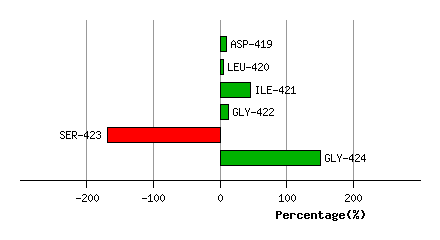
Graph shows rotational transition at bending residues and can be used
to identify hinge bending residues.
Probably only informative for interdomain rotations greater than 20 degrees
Residue
iResidue
i+1Distance of hinge axis to residue i in
(A) Distance of hinge axis to residue i in
(A) Change in
(deg) Change in
(deg) Angle of psi(i) axis to hinge axis
(deg) Angle of psi(i) axis to hinge axis
(deg) Percentage Progress
ILE-425
LYS-426
9.3
13.7
-102.2
-37.6
82.0
153.8
224.2
LYS-426
GLU-427
10.4
12.3
163.1
179.2
56.5
93.6
-70.6
GLU-427
LYS-428
10.5
8.8
-114.0
11.2
68.0
62.0
98.7
LYS-428
PHE-429
9.2
9.9
-25.9
-14.9
123.0
118.7
-32.8
PHE-429
ILE-430
10.5
11.1
6.2
10.5
56.0
57.6
10.1
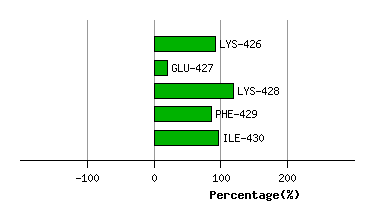
Graph shows rotational transition at bending residues and can be used
to identify hinge bending residues.
Probably only informative for interdomain rotations greater than 20 degrees