Sugar Kinase Mj0406
(All numbering and residues are taken from first PDB file)
![]()
![]()
Bending Residue Dihedral Analysis
Residue
iResidue
i+1Distance of hinge axis to residue i in
(A) Distance of hinge axis to residue i in
(A) Change in
(deg) Change in
(deg) Angle of psi(i) axis to hinge axis
(deg) Angle of psi(i) axis to hinge axis
(deg) Percentage Progress
THR-14
ALA-15
6.2
6.0
17.7
-7.6
91.2
93.4
-15.1
ALA-15
LEU-16
2.5
2.3
17.1
-17.4
29.8
28.3
-2.9
LEU-16
ASP-17
0.8
0.6
-0.2
-3.7
88.4
88.3
73.7
ASP-17
TYR-18
3.2
3.9
0.5
19.6
51.1
53.8
67.8
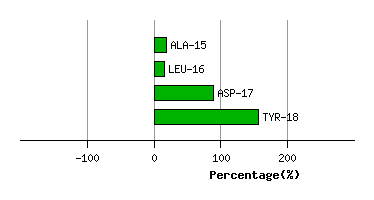
Graph shows rotational transition at bending residues and can be used
to identify hinge bending residues.
Probably only informative for interdomain rotations greater than 20 degrees
Residue
iResidue
i+1Distance of hinge axis to residue i in
(A) Distance of hinge axis to residue i in
(A) Change in
(deg) Change in
(deg) Angle of psi(i) axis to hinge axis
(deg) Angle of psi(i) axis to hinge axis
(deg) Percentage Progress
ALA-37
ARG-38
10.2
10.5
10.3
-52.1
117.2
94.1
77.7
ARG-38
LYS-39
6.9
7.0
15.4
-2.2
42.6
43.8
58.5
LYS-39
TYR-40
4.0
4.3
4.8
13.4
107.9
118.5
-14.0
TYR-40
TYR-41
1.2
1.4
8.1
15.8
43.3
46.6
52.9
TYR-41
GLY-42
2.8
2.6
6.6
-10.7
71.1
70.2
18.6
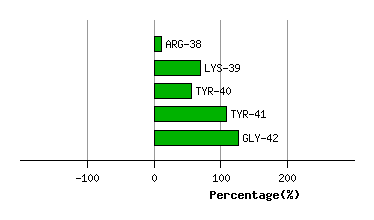
Graph shows rotational transition at bending residues and can be used
to identify hinge bending residues.
Probably only informative for interdomain rotations greater than 20 degrees
Residue
iResidue
i+1Distance of hinge axis to residue i in
(A) Distance of hinge axis to residue i in
(A) Change in
(deg) Change in
(deg) Angle of psi(i) axis to hinge axis
(deg) Angle of psi(i) axis to hinge axis
(deg) Percentage Progress
GLU-94
GLU-95
8.2
7.2
-2.8
-12.2
169.3
176.7
-65.1
GLU-95
THR-96
7.3
6.3
-4.1
-0.6
97.4
105.4
18.2
THR-96
PRO-97
5.0
4.1
3.2
-3.3
95.3
95.3
-1.3
PRO-97
LYS-98
1.2
0.2
2.8
18.8
25.1
31.5
74.1
LYS-98
ALA-99
2.0
2.9
-13.4
-9.1
82.4
87.4
35.4
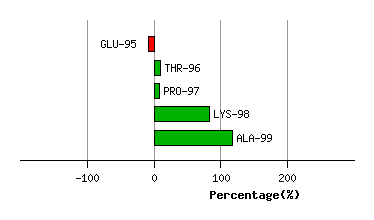
Graph shows rotational transition at bending residues and can be used
to identify hinge bending residues.
Probably only informative for interdomain rotations greater than 20 degrees
Residue
iResidue
i+1Distance of hinge axis to residue i in
(A) Distance of hinge axis to residue i in
(A) Change in
(deg) Change in
(deg) Angle of psi(i) axis to hinge axis
(deg) Angle of psi(i) axis to hinge axis
(deg) Percentage Progress
PHE-113
LEU-114
6.2
7.0
-1.9
-4.0
132.9
137.8
-19.5
LEU-114
TRP-115
4.1
4.7
2.1
-5.4
69.9
76.4
55.6
TRP-115
GLY-116
1.4
2.1
10.6
-6.5
94.5
93.2
10.9
GLY-116
ALA-117
3.3
2.1
-3.3
5.1
108.4
111.7
-0.2
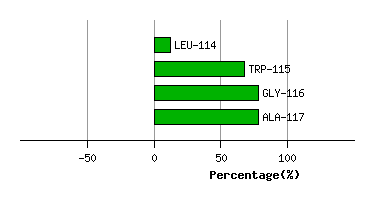
Graph shows rotational transition at bending residues and can be used
to identify hinge bending residues.
Probably only informative for interdomain rotations greater than 20 degrees