Molybdopterin-Guanine Dinucleotide Biosynthesis Protein B (Mobb)
(All numbering and residues are taken from first PDB file)
![]()
![]()
Bending Residue Dihedral Analysis
Residue
iResidue
i+1Distance of hinge axis to residue i in
(A) Distance of hinge axis to residue i in
(A) Change in
(deg) Change in
(deg) Angle of psi(i) axis to hinge axis
(deg) Angle of psi(i) axis to hinge axis
(deg) Percentage Progress
ALA-34
VAL-35
3.6
3.7
5.8
-9.8
79.4
75.5
31.1
VAL-35
VAL-36
3.7
3.8
-2.9
6.3
25.1
27.3
-8.4
VAL-36
LYS-37
4.5
4.6
-12.5
29.4
102.0
102.9
38.8
LYS-37
ARG-38
8.3
8.4
-35.0
0.8
28.6
27.7
420.8
ASP-52
SER-53
22.2
22.3
-63.2
2.7
89.2
76.8
-90.9
SER-53
TRP-54
18.6
18.7
9.5
-6.9
101.8
108.7
21.7
TRP-54
LYS-55
18.6
18.6
7.1
1.2
171.7
172.4
-105.4
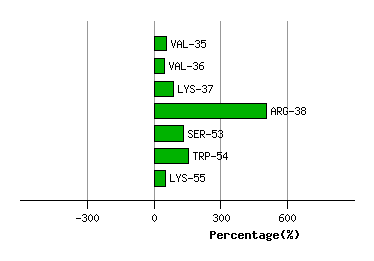
Graph shows rotational transition at bending residues and can be used
to identify hinge bending residues.
Probably only informative for interdomain rotations greater than 20 degrees
Residue
iResidue
i+1Distance of hinge axis to residue i in
(A) Distance of hinge axis to residue i in
(A) Change in
(deg) Change in
(deg) Angle of psi(i) axis to hinge axis
(deg) Angle of psi(i) axis to hinge axis
(deg) Percentage Progress
LEU-85
ASP-86
6.5
6.8
-2.2
-1.3
99.9
94.2
-25.1
ASP-86
TRP-87
7.5
7.7
8.4
0.0
40.8
40.6
71.3
TRP-87
ILE-88
5.5
6.0
-8.8
10.2
68.9
73.8
-61.3
ILE-88
TYR-89
2.4
2.5
4.5
-15.9
122.6
128.0
58.3
TYR-89
GLU-90
4.2
4.1
2.5
-2.8
54.8
64.2
7.6
GLU-90
ARG-91
6.4
7.0
6.4
-0.5
64.8
56.1
-2.5
ARG-91
TYR-92
4.6
5.2
-21.6
10.6
50.6
60.2
149.2
TYR-92
LEU-93
4.5
4.7
13.7
-1.3
157.1
164.8
-127.8
LEU-93
SER-94
4.8
5.0
8.9
-1.2
110.3
114.0
-21.0
SER-94
ASP-95
8.2
8.2
-10.4
27.0
50.5
48.1
-256.8
ASP-95
TYR-96
10.1
10.0
-22.6
3.8
30.1
25.2
245.6
TYR-96
ASP-97
7.6
7.5
-8.5
11.7
47.8
48.4
-66.1
ASP-97
LEU-98
8.1
7.9
-16.7
6.0
75.2
80.9
46.5
LEU-98
VAL-99
4.6
4.4
-8.0
-2.7
132.3
129.3
-59.6
VAL-99
ILE-100
2.1
1.9
4.4
-11.6
120.0
117.3
50.8
ILE-100
THR-101
2.4
2.5
-7.5
10.3
135.4
133.0
108.0
THR-101
GLU-102
5.6
5.6
13.2
-1.4
120.4
127.1
-79.3
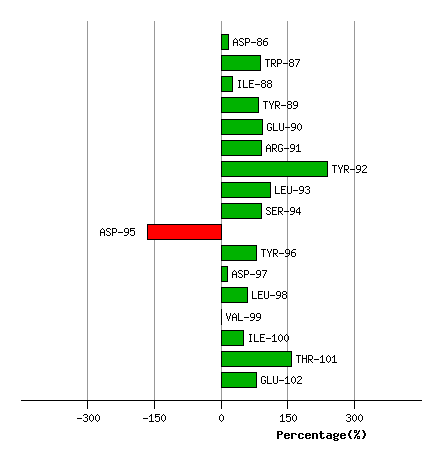
Graph shows rotational transition at bending residues and can be used
to identify hinge bending residues.
Probably only informative for interdomain rotations greater than 20 degrees