Alpha-1 Catenin
(All numbering and residues are taken from first PDB file)
![]()
![]()
Bending Residue Dihedral Analysis
Residue
iResidue
i+1Distance of hinge axis to residue i in
(A) Distance of hinge axis to residue i in
(A) Change in
(deg) Change in
(deg) Angle of psi(i) axis to hinge axis
(deg) Angle of psi(i) axis to hinge axis
(deg) Percentage Progress
PHE-394
LEU-395
14.0
11.3
177.7
-2.7
107.0
94.4
-121.6
LEU-395
GLU-396
10.9
9.5
15.4
0.7
55.3
39.3
75.4
GLU-396
THR-397
10.0
10.8
-143.8
101.3
159.1
154.9
-285.9
THR-397
ASN-398
10.0
9.6
-8.8
-36.2
129.0
109.7
-189.7
ASN-398
VAL-399
8.6
7.1
22.6
0.5
54.7
42.6
86.0
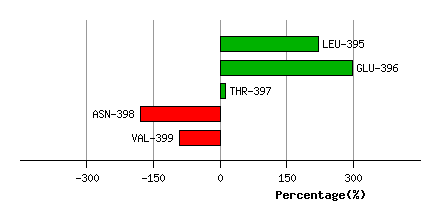
Graph shows rotational transition at bending residues and can be used
to identify hinge bending residues.
Probably only informative for interdomain rotations greater than 20 degrees
Residue
iResidue
i+1Distance of hinge axis to residue i in
(A) Distance of hinge axis to residue i in
(A) Change in
(deg) Change in
(deg) Angle of psi(i) axis to hinge axis
(deg) Angle of psi(i) axis to hinge axis
(deg) Percentage Progress
HIS-426
ALA-427
5.4
5.5
-4.6
5.6
57.0
54.8
13.0
ALA-427
ASN-428
1.8
2.0
-7.7
4.1
22.7
20.5
16.5
ASN-428
LYS-429
3.8
3.9
-10.4
5.1
56.2
54.5
29.6
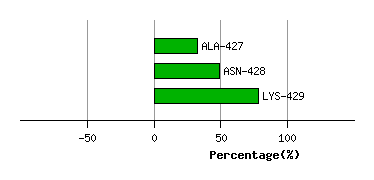
Graph shows rotational transition at bending residues and can be used
to identify hinge bending residues.
Probably only informative for interdomain rotations greater than 20 degrees
Residue
iResidue
i+1Distance of hinge axis to residue i in
(A) Distance of hinge axis to residue i in
(A) Change in
(deg) Change in
(deg) Angle of psi(i) axis to hinge axis
(deg) Angle of psi(i) axis to hinge axis
(deg) Percentage Progress
ALA-459
LEU-460
8.9
9.4
1.5
-8.0
162.2
167.1
32.8
LEU-460
CYS-461
7.8
8.0
-11.9
9.8
60.4
65.3
21.3
CYS-461
PRO-462
5.0
5.3
-9.8
11.1
45.1
52.1
-6.3
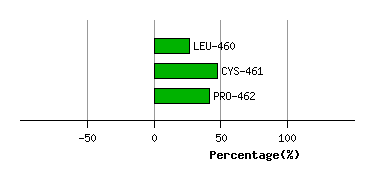
Graph shows rotational transition at bending residues and can be used
to identify hinge bending residues.
Probably only informative for interdomain rotations greater than 20 degrees
Residue
iResidue
i+1Distance of hinge axis to residue i in
(A) Distance of hinge axis to residue i in
(A) Change in
(deg) Change in
(deg) Angle of psi(i) axis to hinge axis
(deg) Angle of psi(i) axis to hinge axis
(deg) Percentage Progress
LYS-493
GLN-494
11.8
11.9
-13.9
9.2
26.3
21.1
33.3
GLN-494
VAL-495
9.8
9.7
-13.4
9.0
60.9
73.8
18.3
VAL-495
ARG-496
8.1
8.0
12.0
-8.4
119.5
110.1
-31.4
ARG-496
VAL-497
11.7
11.7
-12.6
6.7
36.5
25.5
31.3
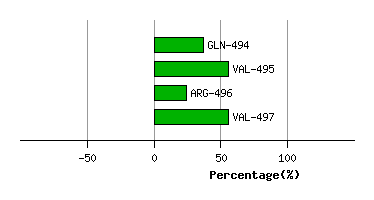
Graph shows rotational transition at bending residues and can be used
to identify hinge bending residues.
Probably only informative for interdomain rotations greater than 20 degrees