Kv4 Potassium Channel-Interacting Protein Kchip1b
(All numbering and residues are taken from first PDB file)
![]()
![]()
Bending Residue Dihedral Analysis
Residue
iResidue
i+1Distance of hinge axis to residue i in
(A) Distance of hinge axis to residue i in
(A) Change in
(deg) Change in
(deg) Angle of psi(i) axis to hinge axis
(deg) Angle of psi(i) axis to hinge axis
(deg) Percentage Progress
TRP-129
THR-130
9.9
9.6
-3.2
0.7
13.0
10.5
10.1
THR-130
PHE-131
9.4
9.1
-2.9
3.8
61.5
66.2
1.1
PHE-131
ASN-132
5.9
5.5
-1.4
3.7
73.5
76.9
-15.6
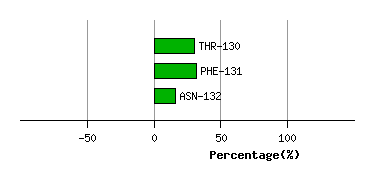
Graph shows rotational transition at bending residues and can be used
to identify hinge bending residues.
Probably only informative for interdomain rotations greater than 20 degrees
Residue
iResidue
i+1Distance of hinge axis to residue i in
(A) Distance of hinge axis to residue i in
(A) Change in
(deg) Change in
(deg) Angle of psi(i) axis to hinge axis
(deg) Angle of psi(i) axis to hinge axis
(deg) Percentage Progress
MET-147
MET-148
4.4
4.0
-7.0
4.4
145.9
142.1
-14.0
MET-148
ASP-149
5.2
5.1
-11.5
16.5
94.3
87.5
-9.9
ASP-149
ILE-150
8.0
8.1
-16.0
2.2
52.5
58.4
39.7
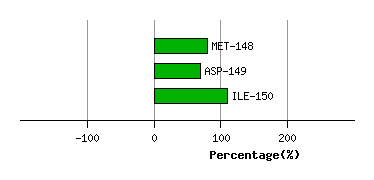
Graph shows rotational transition at bending residues and can be used
to identify hinge bending residues.
Probably only informative for interdomain rotations greater than 20 degrees
Residue
iResidue
i+1Distance of hinge axis to residue i in
(A) Distance of hinge axis to residue i in
(A) Change in
(deg) Change in
(deg) Angle of psi(i) axis to hinge axis
(deg) Angle of psi(i) axis to hinge axis
(deg) Percentage Progress
PRO-171
ARG-172
10.5
9.5
87.7
-17.7
81.4
88.9
60.5
ARG-172
GLN-173
7.2
6.6
23.1
-30.1
71.5
74.6
20.1
GLN-173
HIS-174
9.4
9.5
24.3
-17.7
14.7
13.0
35.6
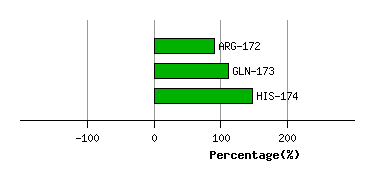
Graph shows rotational transition at bending residues and can be used
to identify hinge bending residues.
Probably only informative for interdomain rotations greater than 20 degrees
Residue
iResidue
i+1Distance of hinge axis to residue i in
(A) Distance of hinge axis to residue i in
(A) Change in
(deg) Change in
(deg) Angle of psi(i) axis to hinge axis
(deg) Angle of psi(i) axis to hinge axis
(deg) Percentage Progress
LYS-184
ASN-185
9.9
11.2
9.6
-4.2
77.4
79.2
-11.7
ASN-185
LYS-186
11.6
12.5
-7.8
-2.6
163.3
162.0
-23.9
LYS-186
ASP-187
11.1
11.4
2.6
13.7
76.9
74.6
46.6
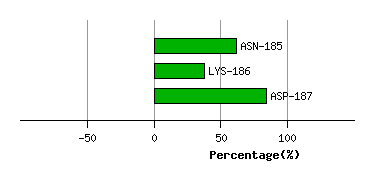
Graph shows rotational transition at bending residues and can be used
to identify hinge bending residues.
Probably only informative for interdomain rotations greater than 20 degrees
Residue
iResidue
i+1Distance of hinge axis to residue i in
(A) Distance of hinge axis to residue i in
(A) Change in
(deg) Change in
(deg) Angle of psi(i) axis to hinge axis
(deg) Angle of psi(i) axis to hinge axis
(deg) Percentage Progress
GLY-188
ILE-189
7.2
7.3
8.9
5.6
59.9
55.6
56.6
ILE-189
VAL-190
5.3
5.5
4.0
-12.2
41.9
45.6
-38.9
VAL-190
THR-191
2.9
3.5
-0.8
-3.0
139.8
141.2
-7.4
THR-191
LEU-192
3.3
3.4
-0.8
1.1
123.1
123.7
1.5
LEU-192
ASP-193
0.9
0.9
-3.0
0.6
113.6
111.6
-20.8
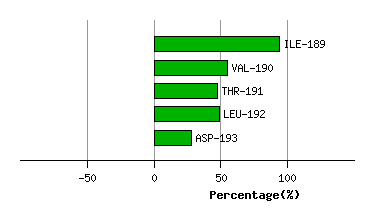
Graph shows rotational transition at bending residues and can be used
to identify hinge bending residues.
Probably only informative for interdomain rotations greater than 20 degrees
Residue
iResidue
i+1Distance of hinge axis to residue i in
(A) Distance of hinge axis to residue i in
(A) Change in
(deg) Change in
(deg) Angle of psi(i) axis to hinge axis
(deg) Angle of psi(i) axis to hinge axis
(deg) Percentage Progress
GLU-197
SER-198
7.7
9.1
8.0
16.8
133.3
135.2
-63.7
GLN-200
GLU-201
11.2
12.0
-35.7
-7.8
88.3
75.0
24.2
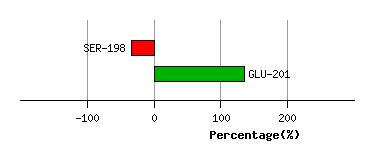
Graph shows rotational transition at bending residues and can be used
to identify hinge bending residues.
Probably only informative for interdomain rotations greater than 20 degrees