Gelsolin
(All numbering and residues are taken from first PDB file)
![]()
![]()
Bending Residue Dihedral Analysis
Residue
iResidue
i+1Distance of hinge axis to residue i in
(A) Distance of hinge axis to residue i in
(A) Change in
(deg) Change in
(deg) Angle of psi(i) axis to hinge axis
(deg) Angle of psi(i) axis to hinge axis
(deg) Percentage Progress
PRO-640
ARG-641
10.0
9.9
18.4
-16.1
18.7
14.1
90.5
ARG-641
LEU-642
11.2
10.9
-14.1
16.4
118.6
123.5
66.1
LEU-642
PHE-643
9.6
9.2
0.2
-1.9
25.8
32.9
-29.6
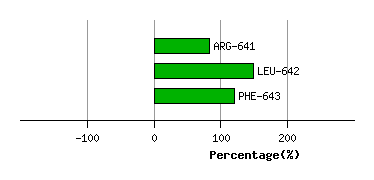
Graph shows rotational transition at bending residues and can be used
to identify hinge bending residues.
Probably only informative for interdomain rotations greater than 20 degrees
Residue
iResidue
i+1Distance of hinge axis to residue i in
(A) Distance of hinge axis to residue i in
(A) Change in
(deg) Change in
(deg) Angle of psi(i) axis to hinge axis
(deg) Angle of psi(i) axis to hinge axis
(deg) Percentage Progress
VAL-719
VAL-720
16.7
16.5
3.4
-2.7
82.2
86.9
-71.9
VAL-720
LYS-721
14.2
14.2
5.5
-9.5
156.2
159.5
45.2
LYS-721
GLN-722
14.3
14.4
-6.4
1.6
82.8
81.1
71.5
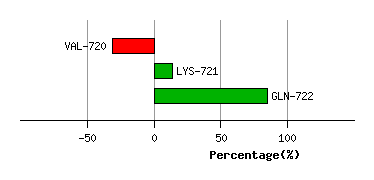
Graph shows rotational transition at bending residues and can be used
to identify hinge bending residues.
Probably only informative for interdomain rotations greater than 20 degrees
Residue
iResidue
i+1Distance of hinge axis to residue i in
(A) Distance of hinge axis to residue i in
(A) Change in
(deg) Change in
(deg) Angle of psi(i) axis to hinge axis
(deg) Angle of psi(i) axis to hinge axis
(deg) Percentage Progress
GLY-723
PHE-724
12.3
13.0
-9.0
-8.8
33.6
29.0
137.3
PHE-724
GLU-725
13.8
14.4
18.5
-14.1
131.9
127.1
-67.4
GLU-725
PRO-726
10.7
11.2
11.7
-8.5
160.7
165.6
-49.6
PRO-726
PRO-727
11.0
11.2
-4.2
9.4
73.1
73.2
73.8
PRO-727
SER-728
8.1
8.3
-1.5
2.9
75.6
80.1
-19.5
SER-728
PHE-729
7.5
7.5
-2.0
-5.4
143.0
144.6
4.6
PHE-729
VAL-730
7.0
6.9
-1.7
0.8
104.9
106.1
-64.2
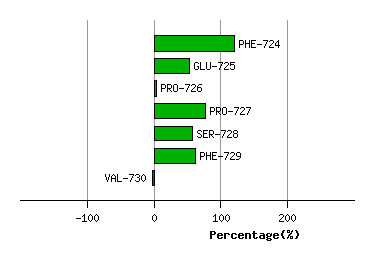
Graph shows rotational transition at bending residues and can be used
to identify hinge bending residues.
Probably only informative for interdomain rotations greater than 20 degrees
Residue
iResidue
i+1Distance of hinge axis to residue i in
(A) Distance of hinge axis to residue i in
(A) Change in
(deg) Change in
(deg) Angle of psi(i) axis to hinge axis
(deg) Angle of psi(i) axis to hinge axis
(deg) Percentage Progress
TRP-732
PHE-733
2.5
2.0
-9.8
14.1
144.7
142.5
42.9
PHE-733
LEU-734
0.5
0.6
17.9
-18.3
105.6
105.7
-1.7
LEU-734
GLY-735
4.2
4.4
-8.5
21.8
120.9
120.5
58.1
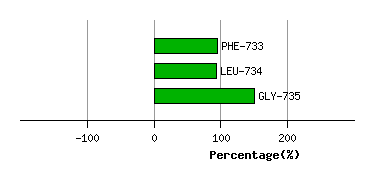
Graph shows rotational transition at bending residues and can be used
to identify hinge bending residues.
Probably only informative for interdomain rotations greater than 20 degrees