6-Deoxyerythronolide B Synthase
(All numbering and residues are taken from first PDB file)
![]()
![]()
Bending Residue Dihedral Analysis
Residue
iResidue
i+1Distance of hinge axis to residue i in
(A) Distance of hinge axis to residue i in
(A) Change in
(deg) Change in
(deg) Angle of psi(i) axis to hinge axis
(deg) Angle of psi(i) axis to hinge axis
(deg) Percentage Progress
PRO-454
GLU-455
18.0
18.4
4.4
-2.2
136.3
132.2
-16.4
GLU-455
ALA-456
20.8
21.1
18.5
-22.9
164.7
168.9
1.4
ALA-456
ASP-457
20.3
20.6
-54.6
-2.1
66.3
60.4
485.5
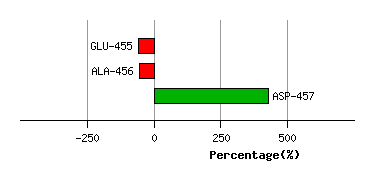
Graph shows rotational transition at bending residues and can be used
to identify hinge bending residues.
Probably only informative for interdomain rotations greater than 20 degrees
Residue
iResidue
i+1Distance of hinge axis to residue i in
(A) Distance of hinge axis to residue i in
(A) Change in
(deg) Change in
(deg) Angle of psi(i) axis to hinge axis
(deg) Angle of psi(i) axis to hinge axis
(deg) Percentage Progress
VAL-471
LEU-472
6.5
6.7
-6.5
7.4
46.0
47.2
-33.6
LEU-472
SER-473
3.5
3.8
-5.3
0.7
115.3
116.0
-65.0
SER-473
GLY-474
1.5
1.6
-7.8
9.0
48.0
50.9
29.8
GLY-474
ARG-475
4.6
4.6
3.1
4.3
60.4
64.2
103.8
ARG-475
ASP-476
7.6
7.6
-18.2
6.3
121.8
127.1
-104.4
ASP-476
GLU-477
9.3
9.6
-13.2
6.9
98.9
95.0
22.0
GLU-477
GLN-478
9.5
9.7
-0.9
-2.7
38.9
41.4
46.6
GLN-478
ALA-479
11.4
11.8
12.1
-5.0
131.3
135.4
-31.2
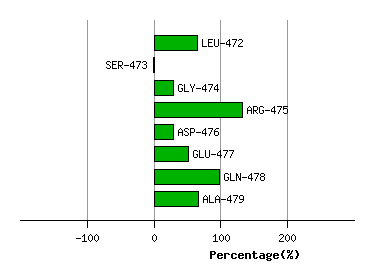
Graph shows rotational transition at bending residues and can be used
to identify hinge bending residues.
Probably only informative for interdomain rotations greater than 20 degrees
Residue
iResidue
i+1Distance of hinge axis to residue i in
(A) Distance of hinge axis to residue i in
(A) Change in
(deg) Change in
(deg) Angle of psi(i) axis to hinge axis
(deg) Angle of psi(i) axis to hinge axis
(deg) Percentage Progress
ALA-482
GLN-483
9.8
10.0
0.9
-5.3
72.8
75.1
-56.2
GLN-483
ALA-484
6.5
6.7
2.1
-0.6
101.7
100.7
70.5
ALA-484
GLY-485
9.0
9.1
-15.3
19.3
127.8
129.8
106.8
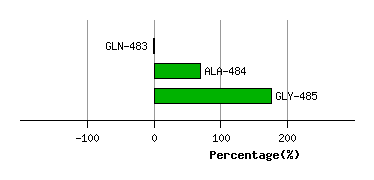
Graph shows rotational transition at bending residues and can be used
to identify hinge bending residues.
Probably only informative for interdomain rotations greater than 20 degrees
Residue
iResidue
i+1Distance of hinge axis to residue i in
(A) Distance of hinge axis to residue i in
(A) Change in
(deg) Change in
(deg) Angle of psi(i) axis to hinge axis
(deg) Angle of psi(i) axis to hinge axis
(deg) Percentage Progress
GLU-494
PRO-495
16.5
16.9
10.5
3.0
51.2
43.0
198.6
PRO-495
ARG-496
19.2
19.7
1.9
-3.3
100.4
100.6
108.7
ARG-496
ASN-497
19.4
19.3
7.2
7.5
58.1
59.3
138.0
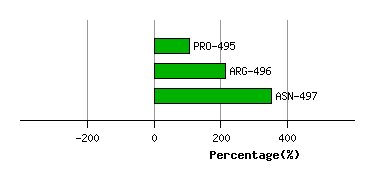
Graph shows rotational transition at bending residues and can be used
to identify hinge bending residues.
Probably only informative for interdomain rotations greater than 20 degrees
Residue
iResidue
i+1Distance of hinge axis to residue i in
(A) Distance of hinge axis to residue i in
(A) Change in
(deg) Change in
(deg) Angle of psi(i) axis to hinge axis
(deg) Angle of psi(i) axis to hinge axis
(deg) Percentage Progress
ARG-500
ASP-501
17.1
16.9
-3.6
-4.6
121.6
118.4
42.9
ASP-501
THR-502
15.5
15.2
-2.3
12.1
85.1
89.4
-46.1
THR-502
GLY-503
12.5
12.2
-0.2
-7.7
32.9
33.3
158.1
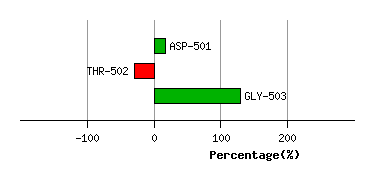
Graph shows rotational transition at bending residues and can be used
to identify hinge bending residues.
Probably only informative for interdomain rotations greater than 20 degrees
Residue
iResidue
i+1Distance of hinge axis to residue i in
(A) Distance of hinge axis to residue i in
(A) Change in
(deg) Change in
(deg) Angle of psi(i) axis to hinge axis
(deg) Angle of psi(i) axis to hinge axis
(deg) Percentage Progress
ALA-507
THR-508
9.0
8.9
7.1
4.8
107.7
105.6
54.6
THR-508
ARG-509
10.8
10.9
-13.3
7.7
37.1
43.4
57.2
ARG-509
ARG-510
8.7
8.9
0.5
1.7
89.8
88.9
29.7
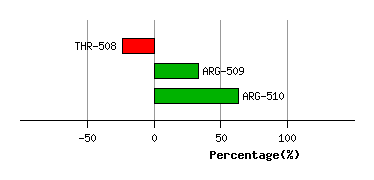
Graph shows rotational transition at bending residues and can be used
to identify hinge bending residues.
Probably only informative for interdomain rotations greater than 20 degrees
Residue
iResidue
i+1Distance of hinge axis to residue i in
(A) Distance of hinge axis to residue i in
(A) Change in
(deg) Change in
(deg) Angle of psi(i) axis to hinge axis
(deg) Angle of psi(i) axis to hinge axis
(deg) Percentage Progress
SER-511
ALA-512
5.5
5.3
-14.7
13.5
35.0
34.1
124.2
ALA-512
TRP-513
4.5
4.4
7.7
-2.5
108.5
105.8
-113.4
TRP-513
GLU-514
4.5
4.3
-3.1
-2.5
21.3
20.7
93.3
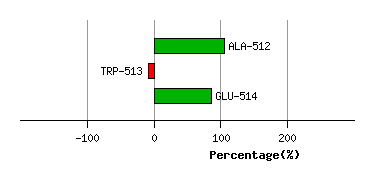
Graph shows rotational transition at bending residues and can be used
to identify hinge bending residues.
Probably only informative for interdomain rotations greater than 20 degrees
Residue
iResidue
i+1Distance of hinge axis to residue i in
(A) Distance of hinge axis to residue i in
(A) Change in
(deg) Change in
(deg) Angle of psi(i) axis to hinge axis
(deg) Angle of psi(i) axis to hinge axis
(deg) Percentage Progress
ALA-534
ASP-535
13.0
13.2
-11.6
8.1
104.6
108.4
10.0
ASP-535
GLY-536
16.3
16.5
17.5
-8.3
29.3
26.5
141.6
GLY-536
ARG-537
15.0
15.1
-8.2
0.4
136.8
142.4
-190.2
ARG-537
ILE-538
16.4
16.2
-3.7
1.5
109.7
108.9
37.4
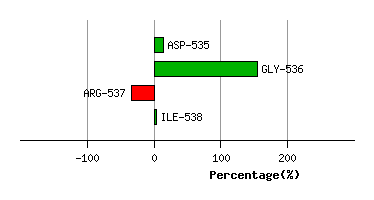
Graph shows rotational transition at bending residues and can be used
to identify hinge bending residues.
Probably only informative for interdomain rotations greater than 20 degrees
Residue
iResidue
i+1Distance of hinge axis to residue i in
(A) Distance of hinge axis to residue i in
(A) Change in
(deg) Change in
(deg) Angle of psi(i) axis to hinge axis
(deg) Angle of psi(i) axis to hinge axis
(deg) Percentage Progress
ALA-878
PHE-879
17.3
17.5
-26.0
35.5
24.6
22.7
-178.1
PHE-879
ALA-880
18.2
17.9
-15.6
46.6
75.7
79.0
-203.7
ALA-880
ASP-881
21.6
21.6
-2.2
-3.2
28.7
4.2
236.2
ASP-881
ALA-882
22.4
22.2
-27.6
29.6
62.6
53.0
226.1
ALA-882
ARG-883
18.8
18.8
29.0
-26.7
137.7
138.2
21.4
ARG-883
PRO-884
17.4
17.2
5.4
-6.9
92.6
94.9
-45.2
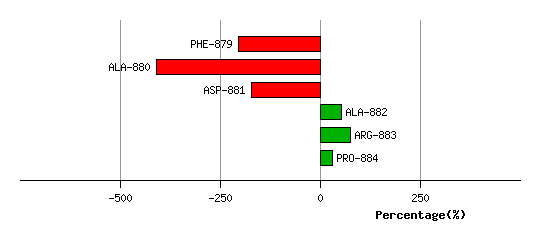
Graph shows rotational transition at bending residues and can be used
to identify hinge bending residues.
Probably only informative for interdomain rotations greater than 20 degrees
Residue
iResidue
i+1Distance of hinge axis to residue i in
(A) Distance of hinge axis to residue i in
(A) Change in
(deg) Change in
(deg) Angle of psi(i) axis to hinge axis
(deg) Angle of psi(i) axis to hinge axis
(deg) Percentage Progress
GLU-886
LEU-887
9.1
8.7
-11.6
4.4
53.9
49.4
111.9
LEU-887
PRO-888
6.9
6.9
-1.6
-3.6
105.8
105.5
79.4
PRO-888
VAL-889
5.0
5.2
13.6
-7.8
108.7
108.3
33.4
VAL-889
TYR-890
1.8
2.0
-1.2
-2.6
133.5
133.7
12.3
VAL-889
TYR-890
1.8
2.0
-1.2
-2.6
133.5
133.7
12.3
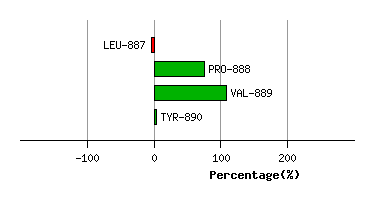
Graph shows rotational transition at bending residues and can be used
to identify hinge bending residues.
Probably only informative for interdomain rotations greater than 20 degrees
Residue
iResidue
i+1Distance of hinge axis to residue i in
(A) Distance of hinge axis to residue i in
(A) Change in
(deg) Change in
(deg) Angle of psi(i) axis to hinge axis
(deg) Angle of psi(i) axis to hinge axis
(deg) Percentage Progress
VAL-889
TYR-890
1.8
2.0
-1.2
-2.6
133.5
133.7
12.3
VAL-889
TYR-890
1.8
2.0
-1.2
-2.6
133.5
133.7
12.3
TYR-890
PRO-891
3.2
3.2
-2.8
0.2
75.2
72.1
65.9
PRO-891
PHE-892
6.8
6.9
6.1
-5.2
78.2
73.7
25.2
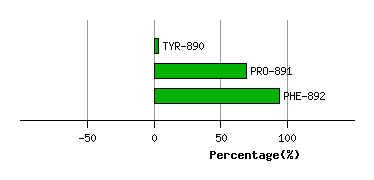
Graph shows rotational transition at bending residues and can be used
to identify hinge bending residues.
Probably only informative for interdomain rotations greater than 20 degrees