Probable Trna Pseudouridine Synthase D
(All numbering and residues are taken from first PDB file)
![]()
![]()
Bending Residue Dihedral Analysis
Residue
iResidue
i+1Distance of hinge axis to residue i in
(A) Distance of hinge axis to residue i in
(A) Change in
(deg) Change in
(deg) Angle of psi(i) axis to hinge axis
(deg) Angle of psi(i) axis to hinge axis
(deg) Percentage Progress
VAL-166
PRO-167
3.3
3.6
4.9
-5.4
16.0
17.4
15.6
PRO-167
ASN-168
1.4
2.0
15.4
-1.0
54.6
50.7
29.6
ASN-168
PHE-169
4.0
4.3
-13.5
44.1
144.0
135.8
215.6
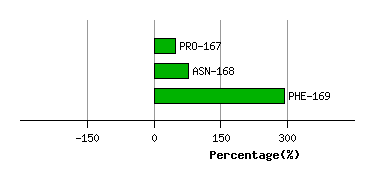
Graph shows rotational transition at bending residues and can be used
to identify hinge bending residues.
Probably only informative for interdomain rotations greater than 20 degrees
Residue
iResidue
i+1Distance of hinge axis to residue i in
(A) Distance of hinge axis to residue i in
(A) Change in
(deg) Change in
(deg) Angle of psi(i) axis to hinge axis
(deg) Angle of psi(i) axis to hinge axis
(deg) Percentage Progress
PHE-170
GLY-171
6.4
6.2
-19.9
32.3
106.4
102.4
46.2
GLY-171
ILE-172
9.4
9.5
-26.6
-3.2
44.5
45.9
164.0
ILE-172
GLN-173
12.4
12.0
9.6
-18.5
120.7
121.4
35.8
GLN-173
ARG-174
14.0
14.1
2.9
12.4
39.0
41.8
103.4
GLN-173
ARG-174
14.0
14.1
2.9
12.4
39.0
41.8
103.4
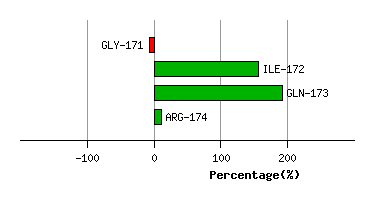
Graph shows rotational transition at bending residues and can be used
to identify hinge bending residues.
Probably only informative for interdomain rotations greater than 20 degrees
Residue
iResidue
i+1Distance of hinge axis to residue i in
(A) Distance of hinge axis to residue i in
(A) Change in
(deg) Change in
(deg) Angle of psi(i) axis to hinge axis
(deg) Angle of psi(i) axis to hinge axis
(deg) Percentage Progress
GLN-173
ARG-174
14.0
14.1
2.9
12.4
39.0
41.8
103.4
GLN-173
ARG-174
14.0
14.1
2.9
12.4
39.0
41.8
103.4
ARG-174
PHE-175
11.1
11.6
-25.8
41.7
143.9
149.1
63.9
PHE-175
GLY-176
11.7
11.4
5.2
58.3
75.6
61.7
125.3
GLY-176
SER-177
15.5
15.0
49.2
-2.2
135.4
126.2
-298.9
SER-177
VAL-178
17.3
18.3
-30.3
-63.9
114.4
57.0
-14.4
VAL-178
ARG-179
20.3
20.5
31.1
32.1
71.1
76.8
181.1
ARG-179
PRO-180
18.5
18.7
5.7
-9.9
78.5
81.2
-19.1
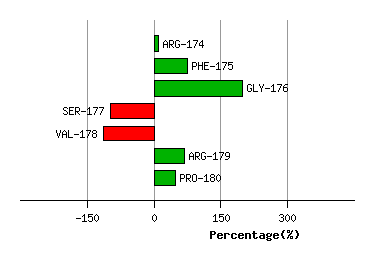
Graph shows rotational transition at bending residues and can be used
to identify hinge bending residues.
Probably only informative for interdomain rotations greater than 20 degrees
Residue
iResidue
i+1Distance of hinge axis to residue i in
(A) Distance of hinge axis to residue i in
(A) Change in
(deg) Change in
(deg) Angle of psi(i) axis to hinge axis
(deg) Angle of psi(i) axis to hinge axis
(deg) Percentage Progress
LEU-261
PRO-262
17.7
17.7
-14.6
6.5
93.5
92.2
-13.1
PRO-262
GLN-263
18.4
17.9
41.0
-21.9
77.5
65.6
40.5
GLN-263
ASN-264
16.1
15.4
29.5
-4.8
17.8
19.6
194.2
ASN-264
LEU-265
16.2
15.8
-28.7
19.1
100.5
94.7
1.5
LEU-265
TYR-266
14.6
13.8
-70.6
63.4
42.2
47.0
60.4
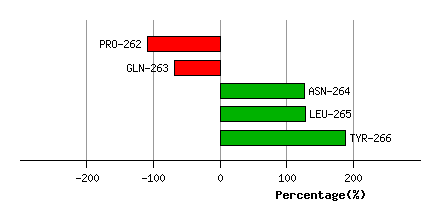
Graph shows rotational transition at bending residues and can be used
to identify hinge bending residues.
Probably only informative for interdomain rotations greater than 20 degrees
Residue
iResidue
i+1Distance of hinge axis to residue i in
(A) Distance of hinge axis to residue i in
(A) Change in
(deg) Change in
(deg) Angle of psi(i) axis to hinge axis
(deg) Angle of psi(i) axis to hinge axis
(deg) Percentage Progress
PHE-269
VAL-270
8.6
8.8
-10.0
5.6
80.5
80.4
16.4
VAL-270
HIS-271
4.8
5.1
8.6
-6.2
155.4
153.9
-18.2
HIS-271
GLY-272
5.3
5.7
7.3
-4.6
135.0
136.4
-21.3
GLY-272
TYR-273
6.7
6.6
-19.2
14.0
84.8
85.8
18.4
TYR-273
GLN-274
4.9
4.8
23.9
-23.4
122.5
114.9
-8.8
GLN-274
SER-275
1.3
1.5
-5.4
2.5
9.3
6.6
28.7
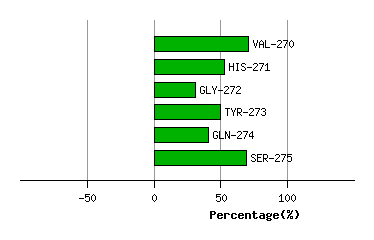
Graph shows rotational transition at bending residues and can be used
to identify hinge bending residues.
Probably only informative for interdomain rotations greater than 20 degrees
Residue
iResidue
i+1Distance of hinge axis to residue i in
(A) Distance of hinge axis to residue i in
(A) Change in
(deg) Change in
(deg) Angle of psi(i) axis to hinge axis
(deg) Angle of psi(i) axis to hinge axis
(deg) Percentage Progress
GLU-363
LEU-364
14.1
14.3
-11.3
39.2
124.1
119.4
115.9
LEU-364
GLY-365
12.2
11.4
4.5
-8.5
15.0
6.5
-26.0
GLY-365
VAL-366
12.9
12.3
-9.5
-9.1
121.0
116.5
-48.4
VAL-366
SER-367
9.3
8.7
0.0
-9.1
44.0
55.1
-46.9
SER-367
LEU-368
8.8
8.5
11.3
-6.0
85.6
83.3
-6.0
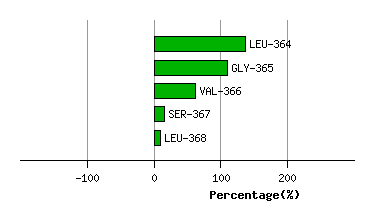
Graph shows rotational transition at bending residues and can be used
to identify hinge bending residues.
Probably only informative for interdomain rotations greater than 20 degrees
Residue
iResidue
i+1Distance of hinge axis to residue i in
(A) Distance of hinge axis to residue i in
(A) Change in
(deg) Change in
(deg) Angle of psi(i) axis to hinge axis
(deg) Angle of psi(i) axis to hinge axis
(deg) Percentage Progress
PHE-371
ASN-372
1.7
2.1
24.2
-19.4
43.8
43.0
8.6
ASN-372
ILE-373
2.6
2.4
1.5
17.2
46.2
50.0
111.8
ILE-373
GLU-374
0.9
1.3
0.1
13.9
24.8
17.6
96.4
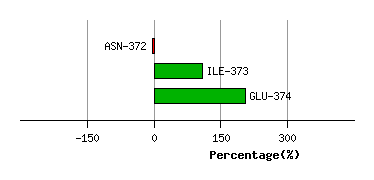
Graph shows rotational transition at bending residues and can be used
to identify hinge bending residues.
Probably only informative for interdomain rotations greater than 20 degrees
Residue
iResidue
i+1Distance of hinge axis to residue i in
(A) Distance of hinge axis to residue i in
(A) Change in
(deg) Change in
(deg) Angle of psi(i) axis to hinge axis
(deg) Angle of psi(i) axis to hinge axis
(deg) Percentage Progress
LYS-382
GLY-383
7.2
7.2
26.8
4.0
28.9
18.3
222.6
GLY-383
THR-384
6.3
6.5
8.8
5.7
54.7
53.4
65.0
THR-384
ARG-385
8.4
8.3
-1.7
-31.9
150.8
146.0
-253.1
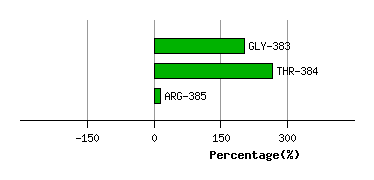
Graph shows rotational transition at bending residues and can be used
to identify hinge bending residues.
Probably only informative for interdomain rotations greater than 20 degrees