Proto-Oncogene Tyrosine-Protein Kinase Src
(All numbering and residues are taken from first PDB file)
![]()
![]()
Bending Residue Dihedral Analysis
Residue
iResidue
i+1Distance of hinge axis to residue i in
(A) Distance of hinge axis to residue i in
(A) Change in
(deg) Change in
(deg) Angle of psi(i) axis to hinge axis
(deg) Angle of psi(i) axis to hinge axis
(deg) Percentage Progress
PHE-185
LEU-186
2.2
2.3
1.0
-5.2
86.4
88.0
17.2
LEU-186
VAL-187
2.3
2.2
-3.6
-3.0
120.1
118.4
-21.0
VAL-187
ARG-188
4.5
4.5
0.6
-15.0
118.5
117.2
39.2
ARG-188
GLU-189
7.9
7.8
11.5
33.0
59.1
69.2
131.3
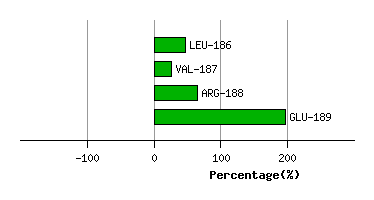
Graph shows rotational transition at bending residues and can be used
to identify hinge bending residues.
Probably only informative for interdomain rotations greater than 20 degrees
Residue
iResidue
i+1Distance of hinge axis to residue i in
(A) Distance of hinge axis to residue i in
(A) Change in
(deg) Change in
(deg) Angle of psi(i) axis to hinge axis
(deg) Angle of psi(i) axis to hinge axis
(deg) Percentage Progress
VAL-212
LYS-213
7.0
7.0
10.3
-19.1
129.3
123.4
49.8
LYS-213
HIS-214
8.6
8.5
11.0
-2.6
116.7
119.3
-22.3
HIS-214
TYR-215
8.3
8.3
6.8
-8.2
147.2
147.3
5.4
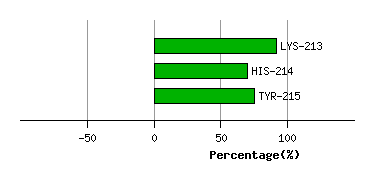
Graph shows rotational transition at bending residues and can be used
to identify hinge bending residues.
Probably only informative for interdomain rotations greater than 20 degrees