Pyruvate Kinase
(All numbering and residues are taken from first PDB file)
![]()
![]()
Bending Residue Dihedral Analysis
Residue
iResidue
i+1Distance of hinge axis to residue i in
(A) Distance of hinge axis to residue i in
(A) Change in
(deg) Change in
(deg) Angle of psi(i) axis to hinge axis
(deg) Angle of psi(i) axis to hinge axis
(deg) Percentage Progress
GLY-87
PRO-88
2.1
1.8
23.1
-10.6
110.5
110.2
-67.1
PRO-88
GLU-89
2.5
2.2
-11.6
-1.7
23.9
29.2
141.4
GLU-89
ILE-90
4.3
4.0
-31.0
29.0
78.2
82.6
39.5
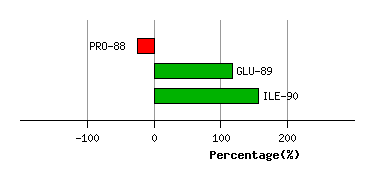
Graph shows rotational transition at bending residues and can be used
to identify hinge bending residues.
Probably only informative for interdomain rotations greater than 20 degrees
Residue
iResidue
i+1Distance of hinge axis to residue i in
(A) Distance of hinge axis to residue i in
(A) Change in
(deg) Change in
(deg) Angle of psi(i) axis to hinge axis
(deg) Angle of psi(i) axis to hinge axis
(deg) Percentage Progress
VAL-145
ASP-146
9.7
9.7
0.9
8.8
91.7
89.7
-6.1
ASP-146
ASP-147
11.0
11.2
2.0
7.2
56.5
57.5
88.9
ASP-147
GLY-148
9.7
10.3
-19.3
13.0
153.7
143.9
-83.0
GLY-148
VAL-149
7.5
7.7
27.8
-33.9
37.5
33.2
-32.7
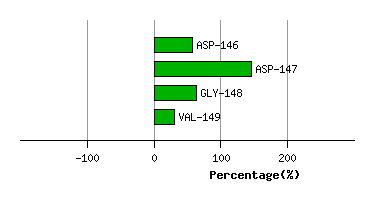
Graph shows rotational transition at bending residues and can be used
to identify hinge bending residues.
Probably only informative for interdomain rotations greater than 20 degrees
Residue
iResidue
i+1Distance of hinge axis to residue i in
(A) Distance of hinge axis to residue i in
(A) Change in
(deg) Change in
(deg) Angle of psi(i) axis to hinge axis
(deg) Angle of psi(i) axis to hinge axis
(deg) Percentage Progress
GLY-183
THR-184
6.5
6.3
-14.5
1.5
58.7
55.0
68.7
THR-184
ASP-185
8.0
7.9
2.7
-13.6
156.2
154.1
128.9
ASP-185
VAL-186
9.5
9.2
-10.6
18.4
45.5
43.2
-96.8
VAL-186
ASP-187
7.8
8.0
-5.0
16.0
32.3
32.4
-113.1
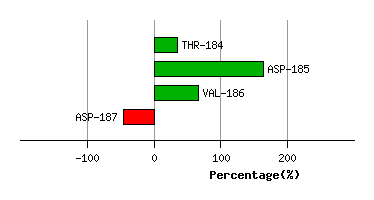
Graph shows rotational transition at bending residues and can be used
to identify hinge bending residues.
Probably only informative for interdomain rotations greater than 20 degrees
Residue
iResidue
i+1Distance of hinge axis to residue i in
(A) Distance of hinge axis to residue i in
(A) Change in
(deg) Change in
(deg) Angle of psi(i) axis to hinge axis
(deg) Angle of psi(i) axis to hinge axis
(deg) Percentage Progress
LEU-188
PRO-189
6.9
7.1
9.6
-20.1
127.1
120.2
92.6
PRO-189
ALA-190
6.0
6.1
2.3
-8.3
81.8
89.9
-5.0
ALA-190
LEU-191
4.1
4.0
15.4
-12.7
139.3
146.8
-52.2
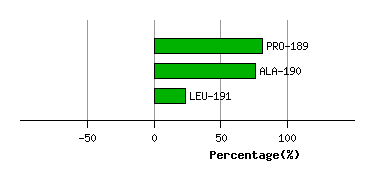
Graph shows rotational transition at bending residues and can be used
to identify hinge bending residues.
Probably only informative for interdomain rotations greater than 20 degrees