R.mvai
(All numbering and residues are taken from first PDB file)
![]()
![]()
Bending Residue Dihedral Analysis
Residue
iResidue
i+1Distance of hinge axis to residue i in
(A) Distance of hinge axis to residue i in
(A) Change in
(deg) Change in
(deg) Angle of psi(i) axis to hinge axis
(deg) Angle of psi(i) axis to hinge axis
(deg) Percentage Progress
SER-0
MET-1
5.6
12.0
15.4
-12.8
112.4
147.2
1.5
MET-1
SER-2
5.5
9.3
25.1
12.0
49.1
72.8
35.6
SER-2
GLU-3
5.0
5.8
-5.3
4.2
120.7
105.8
2.0
GLU-3
TYR-4
7.4
7.0
-30.0
43.5
72.9
45.8
-3.0
TYR-4
LEU-5
9.4
6.4
-55.0
2.0
21.0
33.0
86.6
LEU-5
ASN-6
9.8
7.0
5.9
4.8
95.5
83.1
-3.3
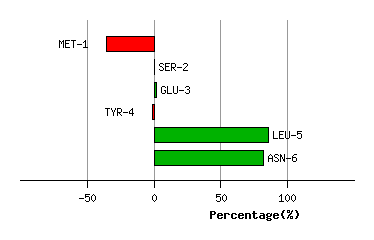
Graph shows rotational transition at bending residues and can be used
to identify hinge bending residues.
Probably only informative for interdomain rotations greater than 20 degrees
Residue
iResidue
i+1Distance of hinge axis to residue i in
(A) Distance of hinge axis to residue i in
(A) Change in
(deg) Change in
(deg) Angle of psi(i) axis to hinge axis
(deg) Angle of psi(i) axis to hinge axis
(deg) Percentage Progress
LEU-66
LEU-67
9.7
7.6
-22.7
-12.8
23.6
17.0
50.6
LEU-67
THR-68
9.1
7.4
15.0
-15.0
121.0
102.1
12.2
THR-68
LEU-69
11.5
9.9
-3.9
15.4
26.7
25.1
-15.8
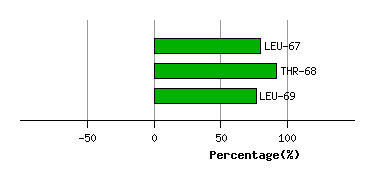
Graph shows rotational transition at bending residues and can be used
to identify hinge bending residues.
Probably only informative for interdomain rotations greater than 20 degrees
Residue
iResidue
i+1Distance of hinge axis to residue i in
(A) Distance of hinge axis to residue i in
(A) Change in
(deg) Change in
(deg) Angle of psi(i) axis to hinge axis
(deg) Angle of psi(i) axis to hinge axis
(deg) Percentage Progress
LYS-158
LYS-159
10.1
9.7
1.1
5.0
112.0
126.6
-7.8
LYS-159
LEU-160
9.1
9.1
17.0
55.5
116.3
116.4
-73.2
LEU-160
LYS-161
6.1
5.5
112.8
-64.6
77.6
64.7
57.5
LYS-161
TYR-162
3.1
4.9
-160.6
69.9
66.5
66.5
92.1
TYR-162
ILE-163
2.6
4.2
26.5
-18.9
125.4
147.2
9.1
ILE-163
ALA-164
4.8
5.6
35.0
-30.3
112.8
98.9
9.2
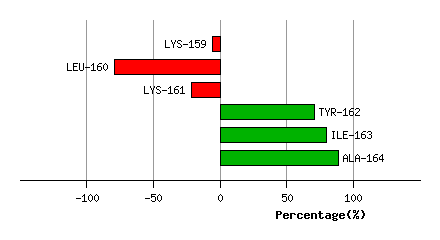
Graph shows rotational transition at bending residues and can be used
to identify hinge bending residues.
Probably only informative for interdomain rotations greater than 20 degrees
Residue
iResidue
i+1Distance of hinge axis to residue i in
(A) Distance of hinge axis to residue i in
(A) Change in
(deg) Change in
(deg) Angle of psi(i) axis to hinge axis
(deg) Angle of psi(i) axis to hinge axis
(deg) Percentage Progress
LEU-186
PHE-187
5.9
7.4
-9.3
25.0
111.9
88.2
0.9
PHE-187
THR-188
2.3
3.8
12.3
1.9
140.1
159.8
-22.5
THR-188
ASP-189
1.7
2.9
179.8
118.6
71.0
99.8
4.5
ASP-189
LEU-190
4.7
3.7
131.2
-71.2
48.6
30.9
97.2
LEU-190
THR-191
5.3
6.0
3.5
37.5
126.7
115.1
-34.6
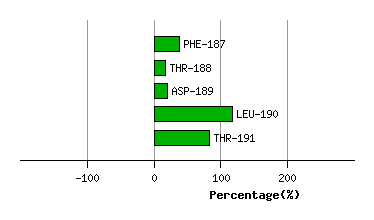
Graph shows rotational transition at bending residues and can be used
to identify hinge bending residues.
Probably only informative for interdomain rotations greater than 20 degrees
Residue
iResidue
i+1Distance of hinge axis to residue i in
(A) Distance of hinge axis to residue i in
(A) Change in
(deg) Change in
(deg) Angle of psi(i) axis to hinge axis
(deg) Angle of psi(i) axis to hinge axis
(deg) Percentage Progress
GLU-238
TYR-239
6.3
6.8
-24.3
22.0
136.8
136.0
1.0
TYR-239
GLY-240
5.8
7.0
-26.2
89.2
158.9
165.8
100.7
GLY-240
GLU-241
4.7
5.3
-29.2
30.8
82.1
115.3
-16.3
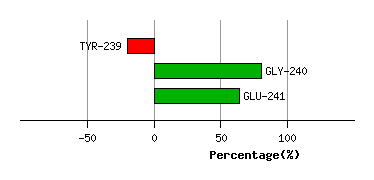
Graph shows rotational transition at bending residues and can be used
to identify hinge bending residues.
Probably only informative for interdomain rotations greater than 20 degrees