4M5.3 Anti-Fluorescein Single Chain Antibody Fragment
(All numbering and residues are taken from first PDB file)
![]()
![]()
Bending Residue Dihedral Analysis
Residue
iResidue
i+1Distance of hinge axis to residue i in
(A) Distance of hinge axis to residue i in
(A) Change in
(deg) Change in
(deg) Angle of psi(i) axis to hinge axis
(deg) Angle of psi(i) axis to hinge axis
(deg) Percentage Progress
PRO-118
THR-119
0.2
0.9
3.0
1.7
70.6
64.3
32.5
THR-119
VAL-120
3.9
3.1
12.9
-4.7
60.1
58.4
42.9
VAL-120
SER-121
5.3
4.7
-2.1
0.2
104.5
103.6
9.7
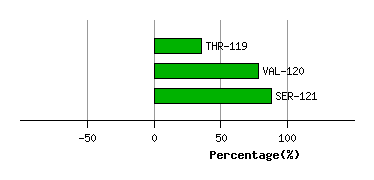
Graph shows rotational transition at bending residues and can be used
to identify hinge bending residues.
Probably only informative for interdomain rotations greater than 20 degrees
Residue
iResidue
i+1Distance of hinge axis to residue i in
(A) Distance of hinge axis to residue i in
(A) Change in
(deg) Change in
(deg) Angle of psi(i) axis to hinge axis
(deg) Angle of psi(i) axis to hinge axis
(deg) Percentage Progress
PHE-140
LEU-141
9.1
9.0
-11.0
20.1
88.9
99.3
24.0
LEU-141
ASN-142
5.7
5.7
37.7
-29.9
13.2
6.0
67.8
ASN-142
ASN-143
5.0
4.7
-18.3
15.7
109.6
119.1
-18.0
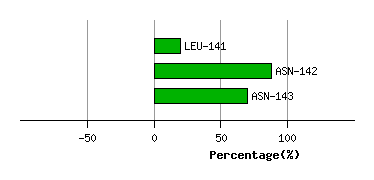
Graph shows rotational transition at bending residues and can be used
to identify hinge bending residues.
Probably only informative for interdomain rotations greater than 20 degrees
Residue
iResidue
i+1Distance of hinge axis to residue i in
(A) Distance of hinge axis to residue i in
(A) Change in
(deg) Change in
(deg) Angle of psi(i) axis to hinge axis
(deg) Angle of psi(i) axis to hinge axis
(deg) Percentage Progress
ASP-148
ILE-149
11.0
12.0
8.0
5.9
49.3
51.6
73.9
ILE-149
ASN-150
9.0
9.7
-12.8
35.5
128.8
142.9
149.5
ASN-150
VAL-151
9.7
10.1
20.5
-34.5
58.2
65.3
-39.9
VAL-151
LYS-152
8.4
8.9
-35.8
37.1
157.3
158.7
-0.2
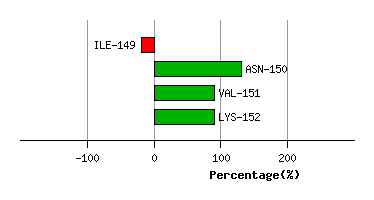
Graph shows rotational transition at bending residues and can be used
to identify hinge bending residues.
Probably only informative for interdomain rotations greater than 20 degrees
Residue
iResidue
i+1Distance of hinge axis to residue i in
(A) Distance of hinge axis to residue i in
(A) Change in
(deg) Change in
(deg) Angle of psi(i) axis to hinge axis
(deg) Angle of psi(i) axis to hinge axis
(deg) Percentage Progress
LEU-165
ASN-166
17.9
17.8
6.1
0.3
58.5
56.7
51.8
ASN-166
SER-167
15.2
15.2
-14.9
-1.4
162.4
161.7
-118.1
SER-167
TRP-168
15.1
15.4
2.3
8.2
62.0
55.5
70.1
TRP-168
THR-169
12.7
13.0
-5.7
25.9
163.7
151.9
151.3
THR-169
ASP-170
11.7
12.2
11.1
-11.7
60.8
51.3
-49.1
ASP-170
GLN-171
11.6
12.2
-4.1
-2.5
95.4
98.8
4.4
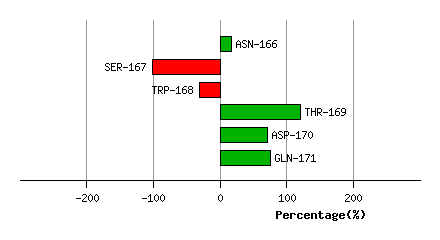
Graph shows rotational transition at bending residues and can be used
to identify hinge bending residues.
Probably only informative for interdomain rotations greater than 20 degrees
Residue
iResidue
i+1Distance of hinge axis to residue i in
(A) Distance of hinge axis to residue i in
(A) Change in
(deg) Change in
(deg) Angle of psi(i) axis to hinge axis
(deg) Angle of psi(i) axis to hinge axis
(deg) Percentage Progress
SER-176
THR-177
4.8
5.0
4.9
3.4
7.7
6.9
64.4
THR-177
TYR-178
4.2
4.5
-11.3
11.2
104.8
107.5
-5.6
TYR-178
SER-179
6.3
6.8
-3.4
3.6
130.4
134.0
15.8
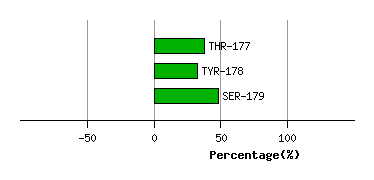
Graph shows rotational transition at bending residues and can be used
to identify hinge bending residues.
Probably only informative for interdomain rotations greater than 20 degrees
Residue
iResidue
i+1Distance of hinge axis to residue i in
(A) Distance of hinge axis to residue i in
(A) Change in
(deg) Change in
(deg) Angle of psi(i) axis to hinge axis
(deg) Angle of psi(i) axis to hinge axis
(deg) Percentage Progress
CYS-199
GLU-200
6.9
6.8
25.4
5.3
83.7
78.2
65.1
GLU-200
ALA-201
4.0
4.3
-21.1
36.4
124.1
141.1
81.3
ALA-201
THR-202
4.8
4.6
-16.0
-14.9
94.8
92.1
11.1
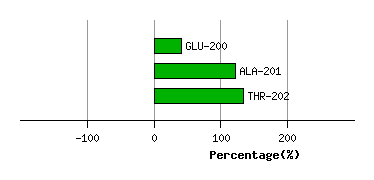
Graph shows rotational transition at bending residues and can be used
to identify hinge bending residues.
Probably only informative for interdomain rotations greater than 20 degrees
Residue
iResidue
i+1Distance of hinge axis to residue i in
(A) Distance of hinge axis to residue i in
(A) Change in
(deg) Change in
(deg) Angle of psi(i) axis to hinge axis
(deg) Angle of psi(i) axis to hinge axis
(deg) Percentage Progress
SER-208
PRO-209
6.9
7.1
0.0
-15.2
62.5
62.3
24.5
PRO-209
ILE-210
3.9
3.9
25.5
-29.2
103.0
100.7
39.0
ILE-210
VAL-211
1.1
0.9
2.6
-1.9
57.1
55.6
20.5
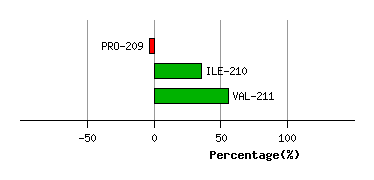
Graph shows rotational transition at bending residues and can be used
to identify hinge bending residues.
Probably only informative for interdomain rotations greater than 20 degrees