Histidyl-Trna Synthetase
(All numbering and residues are taken from first PDB file)
![]()
![]()
Bending Residue Dihedral Analysis
Residue
iResidue
i+1Distance of hinge axis to residue i in
(A) Distance of hinge axis to residue i in
(A) Change in
(deg) Change in
(deg) Angle of psi(i) axis to hinge axis
(deg) Angle of psi(i) axis to hinge axis
(deg) Percentage Progress
PRO-169
GLU-170
11.1
11.2
-7.2
8.3
27.4
16.4
3.9
GLU-170
ASP-171
11.4
10.8
-19.7
11.9
57.3
65.9
39.4
ASP-171
ARG-172
7.7
7.0
-2.5
9.5
71.0
82.0
-19.7
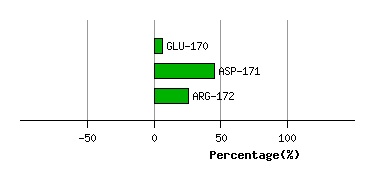
Graph shows rotational transition at bending residues and can be used
to identify hinge bending residues.
Probably only informative for interdomain rotations greater than 20 degrees
Residue
iResidue
i+1Distance of hinge axis to residue i in
(A) Distance of hinge axis to residue i in
(A) Change in
(deg) Change in
(deg) Angle of psi(i) axis to hinge axis
(deg) Angle of psi(i) axis to hinge axis
(deg) Percentage Progress
ASP-227
PHE-228
1.7
2.5
-6.5
0.0
92.8
99.6
-14.5
PHE-228
LEU-229
2.2
1.4
-3.1
-2.2
30.2
38.3
29.0
LEU-229
GLY-230
3.1
2.7
11.0
-4.8
83.3
76.8
26.3
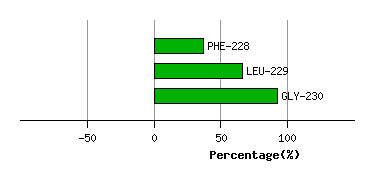
Graph shows rotational transition at bending residues and can be used
to identify hinge bending residues.
Probably only informative for interdomain rotations greater than 20 degrees
Residue
iResidue
i+1Distance of hinge axis to residue i in
(A) Distance of hinge axis to residue i in
(A) Change in
(deg) Change in
(deg) Angle of psi(i) axis to hinge axis
(deg) Angle of psi(i) axis to hinge axis
(deg) Percentage Progress
PRO-255
ALA-256
8.3
8.7
-20.8
-79.2
81.0
97.7
49.0
ALA-256
LEU-257
11.2
8.8
136.3
-40.8
43.1
45.3
424.7
LEU-257
VAL-258
10.4
10.3
-32.2
54.8
75.5
90.3
-7.6
VAL-258
ARG-259
10.1
12.0
-60.3
62.9
126.4
139.1
29.6
ARG-259
GLY-260
11.3
13.4
39.9
7.9
127.5
105.5
-128.7
GLY-260
LEU-261
13.5
16.9
37.4
-59.3
69.8
75.6
-58.4
LEU-261
ASP-262
15.1
16.4
-0.1
-24.8
94.0
60.9
11.4
ASP-262
TYR-263
14.6
15.6
21.8
3.3
30.2
57.6
87.5
TYR-263
TYR-264
13.9
14.6
-4.0
17.8
107.4
97.6
-20.7
TYR-264
VAL-265
10.7
11.0
8.3
-9.9
111.9
122.2
-41.0
VAL-265
ARG-266
7.6
8.4
-20.6
27.4
108.1
110.0
-23.6
ARG-266
THR-267
3.9
4.6
6.9
-15.1
74.3
72.2
-32.7
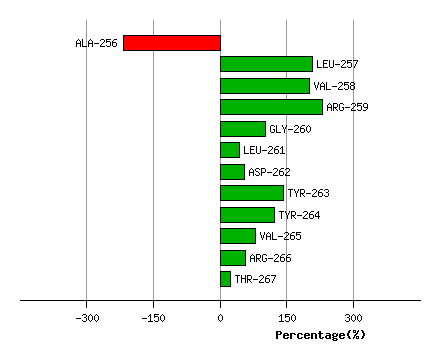
Graph shows rotational transition at bending residues and can be used
to identify hinge bending residues.
Probably only informative for interdomain rotations greater than 20 degrees