Hypothetical Protein Ef2904
(All numbering and residues are taken from first PDB file)
![]()
![]()
Bending Residue Dihedral Analysis
Residue
iResidue
i+1Distance of hinge axis to residue i in
(A) Distance of hinge axis to residue i in
(A) Change in
(deg) Change in
(deg) Angle of psi(i) axis to hinge axis
(deg) Angle of psi(i) axis to hinge axis
(deg) Percentage Progress
THR-7
THR-8
12.5
12.5
0.2
-0.5
100.6
98.0
40.5
THR-8
VAL-9
12.1
12.0
-0.4
5.1
71.9
73.0
46.8
VAL-9
THR-10
10.4
10.3
6.8
-12.8
77.2
75.7
-12.6
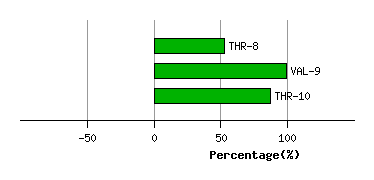
Graph shows rotational transition at bending residues and can be used
to identify hinge bending residues.
Probably only informative for interdomain rotations greater than 20 degrees
Residue
iResidue
i+1Distance of hinge axis to residue i in
(A) Distance of hinge axis to residue i in
(A) Change in
(deg) Change in
(deg) Angle of psi(i) axis to hinge axis
(deg) Angle of psi(i) axis to hinge axis
(deg) Percentage Progress
SER-13
GLY-14
14.4
14.5
6.9
-6.0
16.2
18.2
61.5
GLY-14
ILE-15
14.8
15.3
-12.0
17.9
135.2
139.7
16.8
ILE-15
LEU-16
16.6
16.8
-0.4
1.9
107.8
114.0
-68.9
LEU-16
THR-17
19.3
19.4
11.5
-21.0
105.1
101.8
36.4
THR-17
ILE-18
19.0
19.2
-5.9
-5.2
115.2
104.8
18.0
ILE-18
GLY-19
17.5
17.5
-13.4
34.8
40.0
41.0
-337.7
GLY-19
GLY-20
15.8
16.4
-15.7
-2.1
27.1
34.2
376.7
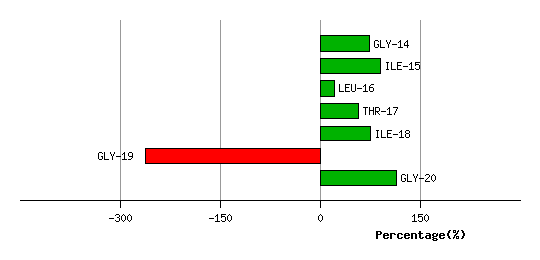
Graph shows rotational transition at bending residues and can be used
to identify hinge bending residues.
Probably only informative for interdomain rotations greater than 20 degrees
Residue
iResidue
i+1Distance of hinge axis to residue i in
(A) Distance of hinge axis to residue i in
(A) Change in
(deg) Change in
(deg) Angle of psi(i) axis to hinge axis
(deg) Angle of psi(i) axis to hinge axis
(deg) Percentage Progress
LEU-90
SER-91
8.2
8.3
-1.0
5.6
163.4
162.0
88.1
SER-91
HIS-92
7.9
8.0
-1.0
-3.4
113.7
109.1
-64.7
HIS-92
ALA-93
11.6
11.8
-5.5
7.6
54.1
55.5
-24.6
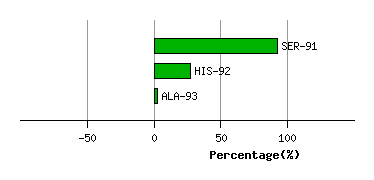
Graph shows rotational transition at bending residues and can be used
to identify hinge bending residues.
Probably only informative for interdomain rotations greater than 20 degrees
Residue
iResidue
i+1Distance of hinge axis to residue i in
(A) Distance of hinge axis to residue i in
(A) Change in
(deg) Change in
(deg) Angle of psi(i) axis to hinge axis
(deg) Angle of psi(i) axis to hinge axis
(deg) Percentage Progress
ASP-96
HIS-97
16.2
16.4
1.2
1.9
76.7
76.5
34.6
HIS-97
SER-98
12.8
13.0
2.5
2.5
34.1
30.3
71.1
SER-98
ARG-99
14.1
14.2
-1.9
0.1
136.7
139.0
2.4
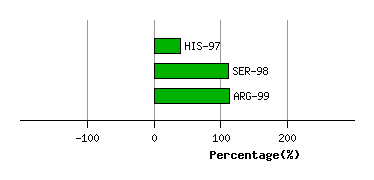
Graph shows rotational transition at bending residues and can be used
to identify hinge bending residues.
Probably only informative for interdomain rotations greater than 20 degrees
Residue
iResidue
i+1Distance of hinge axis to residue i in
(A) Distance of hinge axis to residue i in
(A) Change in
(deg) Change in
(deg) Angle of psi(i) axis to hinge axis
(deg) Angle of psi(i) axis to hinge axis
(deg) Percentage Progress
ILE-145
GLY-146
13.1
13.2
-9.0
10.0
176.3
175.5
9.5
GLY-146
LEU-147
14.7
14.8
-1.9
1.4
115.1
110.3
-11.1
LEU-147
ASN-148
13.5
13.7
7.5
0.3
21.1
20.9
138.7
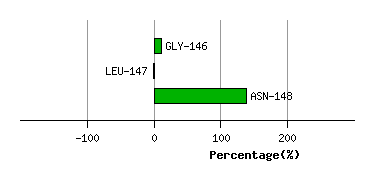
Graph shows rotational transition at bending residues and can be used
to identify hinge bending residues.
Probably only informative for interdomain rotations greater than 20 degrees
Residue
iResidue
i+1Distance of hinge axis to residue i in
(A) Distance of hinge axis to residue i in
(A) Change in
(deg) Change in
(deg) Angle of psi(i) axis to hinge axis
(deg) Angle of psi(i) axis to hinge axis
(deg) Percentage Progress
ASP-151
VAL-152
12.3
12.1
11.9
5.0
75.4
73.0
288.8
VAL-152
ILE-153
10.5
10.6
-9.5
3.4
175.3
174.0
-269.0
ILE-153
LYS-154
9.3
9.2
6.6
-16.0
70.0
73.4
8.0
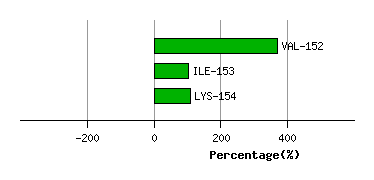
Graph shows rotational transition at bending residues and can be used
to identify hinge bending residues.
Probably only informative for interdomain rotations greater than 20 degrees
Residue
iResidue
i+1Distance of hinge axis to residue i in
(A) Distance of hinge axis to residue i in
(A) Change in
(deg) Change in
(deg) Angle of psi(i) axis to hinge axis
(deg) Angle of psi(i) axis to hinge axis
(deg) Percentage Progress
VAL-160
GLU-161
5.9
5.9
2.0
-1.1
58.4
58.2
11.1
GLU-161
ILE-162
7.3
7.2
2.7
-2.7
70.2
72.1
-27.3
ILE-162
VAL-163
7.0
7.1
-14.3
12.7
151.6
151.9
59.1
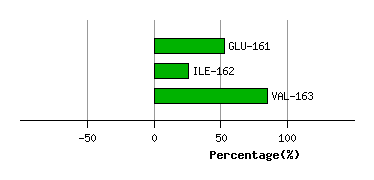
Graph shows rotational transition at bending residues and can be used
to identify hinge bending residues.
Probably only informative for interdomain rotations greater than 20 degrees
Residue
iResidue
i+1Distance of hinge axis to residue i in
(A) Distance of hinge axis to residue i in
(A) Change in
(deg) Change in
(deg) Angle of psi(i) axis to hinge axis
(deg) Angle of psi(i) axis to hinge axis
(deg) Percentage Progress
LEU-190
ARG-191
8.6
8.6
-2.6
1.8
21.8
20.9
39.0
ARG-191
LEU-192
9.3
9.3
-0.5
-0.6
54.8
55.1
1.3
LEU-192
HIS-193
8.5
8.4
1.9
-3.4
125.4
128.0
-4.0
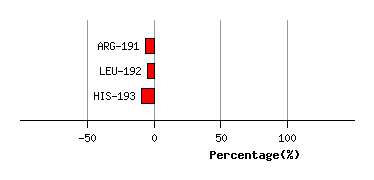
Graph shows rotational transition at bending residues and can be used
to identify hinge bending residues.
Probably only informative for interdomain rotations greater than 20 degrees
Residue
iResidue
i+1Distance of hinge axis to residue i in
(A) Distance of hinge axis to residue i in
(A) Change in
(deg) Change in
(deg) Angle of psi(i) axis to hinge axis
(deg) Angle of psi(i) axis to hinge axis
(deg) Percentage Progress
ARG-197
GLU-198
9.9
10.1
3.8
-12.6
89.5
99.4
39.1
GLU-198
GLU-199
9.8
9.9
10.2
-4.8
155.5
160.4
-90.9
GLU-199
THR-200
9.3
9.5
8.2
0.9
95.6
95.8
57.0
THR-200
LEU-201
5.9
6.1
-11.6
4.6
55.5
61.5
51.2
THR-200
LEU-201
5.9
6.1
-11.6
4.6
55.5
61.5
51.2
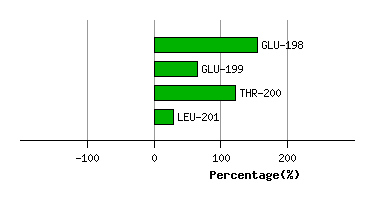
Graph shows rotational transition at bending residues and can be used
to identify hinge bending residues.
Probably only informative for interdomain rotations greater than 20 degrees
Residue
iResidue
i+1Distance of hinge axis to residue i in
(A) Distance of hinge axis to residue i in
(A) Change in
(deg) Change in
(deg) Angle of psi(i) axis to hinge axis
(deg) Angle of psi(i) axis to hinge axis
(deg) Percentage Progress
THR-200
LEU-201
5.9
6.1
-11.6
4.6
55.5
61.5
51.2
THR-200
LEU-201
5.9
6.1
-11.6
4.6
55.5
61.5
51.2
LEU-201
ALA-202
5.3
5.4
-0.5
-3.2
120.3
122.8
-31.7
ALA-202
PHE-203
7.6
7.7
6.5
-5.9
42.4
40.6
44.6
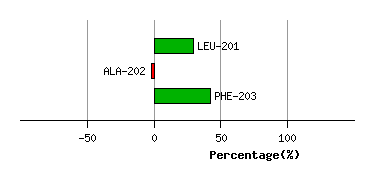
Graph shows rotational transition at bending residues and can be used
to identify hinge bending residues.
Probably only informative for interdomain rotations greater than 20 degrees
Residue
iResidue
i+1Distance of hinge axis to residue i in
(A) Distance of hinge axis to residue i in
(A) Change in
(deg) Change in
(deg) Angle of psi(i) axis to hinge axis
(deg) Angle of psi(i) axis to hinge axis
(deg) Percentage Progress
LYS-208
HIS-209
7.5
7.5
5.4
-0.7
118.8
121.4
-167.9
HIS-209
THR-210
10.2
10.1
-3.1
-1.9
10.8
14.1
93.3
THR-210
GLU-211
8.9
8.7
3.6
-19.9
100.2
100.4
57.4
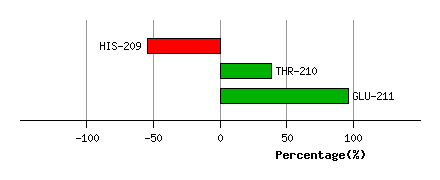
Graph shows rotational transition at bending residues and can be used
to identify hinge bending residues.
Probably only informative for interdomain rotations greater than 20 degrees
Residue
iResidue
i+1Distance of hinge axis to residue i in
(A) Distance of hinge axis to residue i in
(A) Change in
(deg) Change in
(deg) Angle of psi(i) axis to hinge axis
(deg) Angle of psi(i) axis to hinge axis
(deg) Percentage Progress
ASP-389
LYS-390
8.0
7.9
2.0
-10.1
104.2
105.0
-122.8
LYS-390
ILE-391
4.4
4.3
6.2
1.7
36.8
36.3
135.6
ILE-391
ILE-392
3.2
3.0
0.0
0.3
106.1
105.5
-27.2
ILE-392
ALA-393
6.0
5.8
-2.7
-0.4
129.4
129.9
-28.9
ILE-392
ALA-393
6.0
5.8
-2.7
-0.4
129.4
129.9
-28.9
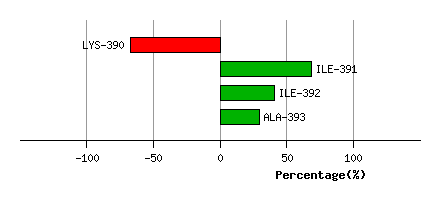
Graph shows rotational transition at bending residues and can be used
to identify hinge bending residues.
Probably only informative for interdomain rotations greater than 20 degrees
Residue
iResidue
i+1Distance of hinge axis to residue i in
(A) Distance of hinge axis to residue i in
(A) Change in
(deg) Change in
(deg) Angle of psi(i) axis to hinge axis
(deg) Angle of psi(i) axis to hinge axis
(deg) Percentage Progress
ILE-392
ALA-393
6.0
5.8
-2.7
-0.4
129.4
129.9
-28.9
ILE-392
ALA-393
6.0
5.8
-2.7
-0.4
129.4
129.9
-28.9
ALA-393
LEU-394
5.8
5.7
-6.9
10.9
79.1
79.3
41.9
LEU-394
ILE-395
3.8
3.6
-3.9
3.4
35.3
35.7
-14.5
ILE-395
GLU-396
5.3
5.1
-4.4
7.7
88.1
88.1
16.6
ILE-395
GLU-396
5.3
5.1
-4.4
7.7
88.1
88.1
16.6
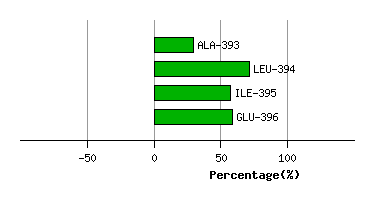
Graph shows rotational transition at bending residues and can be used
to identify hinge bending residues.
Probably only informative for interdomain rotations greater than 20 degrees
Residue
iResidue
i+1Distance of hinge axis to residue i in
(A) Distance of hinge axis to residue i in
(A) Change in
(deg) Change in
(deg) Angle of psi(i) axis to hinge axis
(deg) Angle of psi(i) axis to hinge axis
(deg) Percentage Progress
ILE-395
GLU-396
5.3
5.1
-4.4
7.7
88.1
88.1
16.6
ILE-395
GLU-396
5.3
5.1
-4.4
7.7
88.1
88.1
16.6
GLU-396
PRO-397
8.7
8.6
1.3
-8.5
21.5
22.6
-100.2
PRO-397
GLN-398
9.4
9.3
0.4
1.0
87.3
87.7
101.7
GLN-398
VAL-399
12.9
12.9
0.7
-1.7
109.2
108.3
-8.7
GLN-398
VAL-399
12.9
12.9
0.7
-1.7
109.2
108.3
-8.7
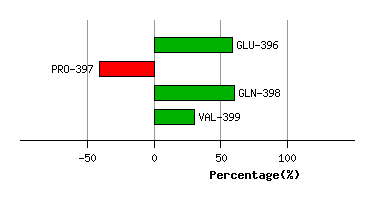
Graph shows rotational transition at bending residues and can be used
to identify hinge bending residues.
Probably only informative for interdomain rotations greater than 20 degrees
Residue
iResidue
i+1Distance of hinge axis to residue i in
(A) Distance of hinge axis to residue i in
(A) Change in
(deg) Change in
(deg) Angle of psi(i) axis to hinge axis
(deg) Angle of psi(i) axis to hinge axis
(deg) Percentage Progress
GLN-398
VAL-399
12.9
12.9
0.7
-1.7
109.2
108.3
-8.7
GLN-398
VAL-399
12.9
12.9
0.7
-1.7
109.2
108.3
-8.7
VAL-399
LEU-400
12.9
12.8
-4.9
0.2
91.3
89.4
5.3
LEU-400
VAL-401
11.2
11.1
-1.6
3.2
48.5
49.5
5.1
VAL-401
PRO-402
11.7
11.7
5.1
0.0
79.1
77.7
45.0
PRO-402
ILE-403
12.4
12.3
2.2
-0.1
150.5
150.4
-18.8
ILE-403
HIS-404
12.5
12.3
1.0
-5.0
71.8
70.5
-86.9
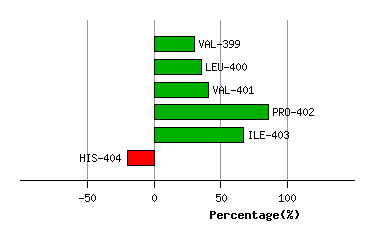
Graph shows rotational transition at bending residues and can be used
to identify hinge bending residues.
Probably only informative for interdomain rotations greater than 20 degrees