Bira Bifunctional Protein (Acts As Biotin Operon Repressor 3 And Biotin Holoenzyme Synthetase) (E.C.6.3.4.15)
(All numbering and residues are taken from first PDB file)
![]()
![]()
Bending Residue Dihedral Analysis
Residue
iResidue
i+1Distance of hinge axis to residue i in
(A) Distance of hinge axis to residue i in
(A) Change in
(deg) Change in
(deg) Angle of psi(i) axis to hinge axis
(deg) Angle of psi(i) axis to hinge axis
(deg) Percentage Progress
ILE-64
GLN-65
4.6
4.4
-50.7
19.6
113.4
100.3
-111.6
GLN-65
LEU-66
6.7
7.8
-52.5
80.3
127.8
143.4
66.2
LEU-66
LEU-67
7.3
8.1
10.7
-13.6
44.8
42.4
21.4
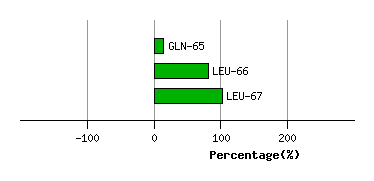
Graph shows rotational transition at bending residues and can be used
to identify hinge bending residues.
Probably only informative for interdomain rotations greater than 20 degrees
Residue
iResidue
i+1Distance of hinge axis to residue i in
(A) Distance of hinge axis to residue i in
(A) Change in
(deg) Change in
(deg) Angle of psi(i) axis to hinge axis
(deg) Angle of psi(i) axis to hinge axis
(deg) Percentage Progress
ALA-82
VAL-83
13.3
12.7
7.4
2.8
47.1
46.8
36.5
VAL-83
LEU-84
11.6
11.0
9.4
14.0
65.7
81.5
-7.3
LEU-84
PRO-85
10.4
10.1
23.5
0.6
63.7
43.0
82.9
PRO-85
VAL-86
7.8
9.6
-28.0
-7.2
79.4
73.9
1.1
VAL-86
ILE-87
8.7
9.6
-0.3
16.0
27.0
12.0
-12.3
ILE-87
ASP-88
9.3
9.3
-3.7
-4.9
65.8
72.5
-1.1
ASP-88
SER-89
9.8
9.3
12.8
-5.8
114.3
108.7
-43.9
SER-89
THR-90
6.8
5.9
-11.4
7.9
71.8
73.8
11.0
THR-90
ASN-91
5.7
4.8
3.6
-2.4
173.1
173.7
6.2
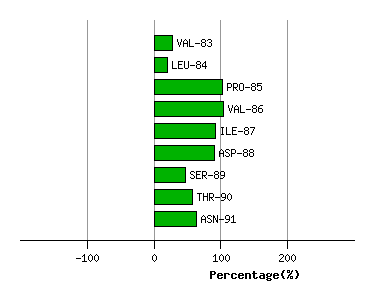
Graph shows rotational transition at bending residues and can be used
to identify hinge bending residues.
Probably only informative for interdomain rotations greater than 20 degrees
Residue
iResidue
i+1Distance of hinge axis to residue i in
(A) Distance of hinge axis to residue i in
(A) Change in
(deg) Change in
(deg) Angle of psi(i) axis to hinge axis
(deg) Angle of psi(i) axis to hinge axis
(deg) Percentage Progress
ILE-108
ALA-109
7.6
6.9
6.6
16.1
46.8
55.7
64.8
ALA-109
GLU-110
5.4
5.6
-9.9
45.9
122.7
143.9
188.6
GLU-110
TYR-111
2.7
4.5
-45.2
14.6
101.5
83.0
-22.3
TYR-111
GLN-112
4.2
5.0
18.6
-5.5
144.4
155.3
-61.5
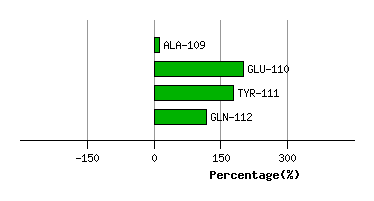
Graph shows rotational transition at bending residues and can be used
to identify hinge bending residues.
Probably only informative for interdomain rotations greater than 20 degrees
Residue
iResidue
i+1Distance of hinge axis to residue i in
(A) Distance of hinge axis to residue i in
(A) Change in
(deg) Change in
(deg) Angle of psi(i) axis to hinge axis
(deg) Angle of psi(i) axis to hinge axis
(deg) Percentage Progress
PRO-126
PHE-127
5.9
5.0
-3.1
-7.2
93.9
78.9
6.5
PHE-127
GLY-128
3.7
3.6
15.0
-41.3
108.3
116.4
-5.0
GLY-128
ALA-129
0.2
1.6
25.3
-29.4
79.9
99.2
-21.1
ALA-129
ASN-130
3.5
2.5
7.4
2.8
35.4
43.8
40.2
ASN-130
LEU-131
3.1
3.7
9.7
14.4
74.7
58.5
55.2
LEU-131
TYR-132
3.6
4.4
-3.1
-5.6
162.3
145.7
-50.9
TYR-132
LEU-133
2.5
2.2
-42.3
25.5
114.4
122.5
-20.4
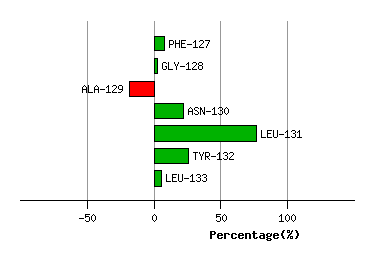
Graph shows rotational transition at bending residues and can be used
to identify hinge bending residues.
Probably only informative for interdomain rotations greater than 20 degrees
Residue
iResidue
i+1Distance of hinge axis to residue i in
(A) Distance of hinge axis to residue i in
(A) Change in
(deg) Change in
(deg) Angle of psi(i) axis to hinge axis
(deg) Angle of psi(i) axis to hinge axis
(deg) Percentage Progress
TRP-223
ILE-224
14.7
14.8
40.0
-16.7
35.9
46.1
10.4
ILE-224
THR-225
14.2
14.4
-7.5
15.6
96.4
93.8
19.4
THR-225
LEU-226
11.8
12.2
5.7
-5.4
69.2
84.0
-4.7
LEU-226
GLN-227
12.4
13.2
-1.0
13.8
168.8
160.2
62.6
GLN-227
GLU-228
12.0
13.2
4.8
-17.0
78.6
82.3
61.4
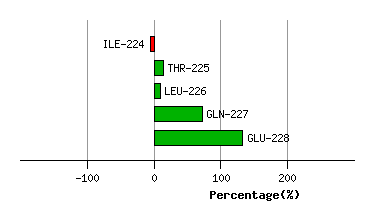
Graph shows rotational transition at bending residues and can be used
to identify hinge bending residues.
Probably only informative for interdomain rotations greater than 20 degrees
Residue
iResidue
i+1Distance of hinge axis to residue i in
(A) Distance of hinge axis to residue i in
(A) Change in
(deg) Change in
(deg) Angle of psi(i) axis to hinge axis
(deg) Angle of psi(i) axis to hinge axis
(deg) Percentage Progress
LEU-233
ASP-234
13.0
12.8
5.5
-5.5
103.9
99.7
13.8
ASP-234
ARG-235
12.5
11.5
14.5
0.3
32.5
25.5
120.6
ARG-235
ASN-236
9.8
9.1
-7.3
7.0
121.3
120.9
-13.1
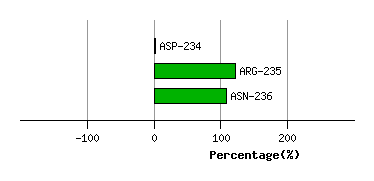
Graph shows rotational transition at bending residues and can be used
to identify hinge bending residues.
Probably only informative for interdomain rotations greater than 20 degrees