Meso-Diaminopimelate D-Dehydrogenase
(All numbering and residues are taken from first PDB file)
![]()
![]()
Bending Residue Dihedral Analysis
Residue
iResidue
i+1Distance of hinge axis to residue i in
(A) Distance of hinge axis to residue i in
(A) Change in
(deg) Change in
(deg) Angle of psi(i) axis to hinge axis
(deg) Angle of psi(i) axis to hinge axis
(deg) Percentage Progress
HIS-638
GLN-639
2.1
2.0
0.1
0.1
61.9
63.4
-11.4
GLN-639
GLN-640
4.8
4.7
4.7
1.2
25.7
25.0
40.3
GLN-640
HIS-641
4.0
3.9
-4.8
14.2
134.2
135.2
70.6
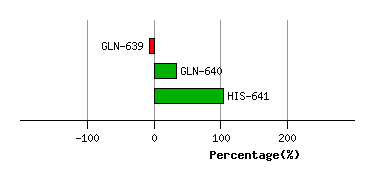
Graph shows rotational transition at bending residues and can be used
to identify hinge bending residues.
Probably only informative for interdomain rotations greater than 20 degrees
Residue
iResidue
i+1Distance of hinge axis to residue i in
(A) Distance of hinge axis to residue i in
(A) Change in
(deg) Change in
(deg) Angle of psi(i) axis to hinge axis
(deg) Angle of psi(i) axis to hinge axis
(deg) Percentage Progress
ALA-679
ARG-680
9.5
9.4
12.9
-14.3
76.5
74.7
-5.0
ARG-680
ARG-681
9.8
9.8
2.0
10.4
34.2
32.1
102.2
ARG-681
GLY-682
12.2
12.2
-20.7
24.9
137.5
139.6
14.1
GLY-682
GLU-683
10.0
9.9
-16.9
14.3
103.8
100.3
-21.2
GLU-683
ALA-684
13.2
12.9
6.3
-10.1
120.6
121.1
-3.1
ALA-684
GLY-685
12.4
12.0
15.3
-29.2
59.1
63.9
-77.9
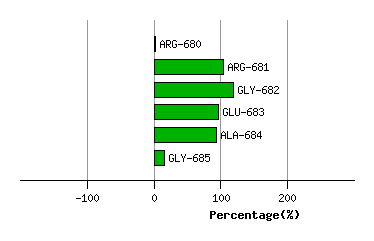
Graph shows rotational transition at bending residues and can be used
to identify hinge bending residues.
Probably only informative for interdomain rotations greater than 20 degrees
Residue
iResidue
i+1Distance of hinge axis to residue i in
(A) Distance of hinge axis to residue i in
(A) Change in
(deg) Change in
(deg) Angle of psi(i) axis to hinge axis
(deg) Angle of psi(i) axis to hinge axis
(deg) Percentage Progress
THR-740
GLY-741
6.2
6.2
21.7
-10.6
45.4
45.6
96.1
GLY-741
MET-742
3.6
3.9
8.0
-8.7
35.6
39.6
4.6
MET-742
PRO-743
4.2
3.8
-12.4
5.0
141.0
144.0
-37.1
PRO-743
HIS-744
2.0
2.0
-1.0
2.4
30.6
31.5
41.4
PRO-743
HIS-744
2.0
2.0
-1.0
2.4
30.6
31.5
41.4
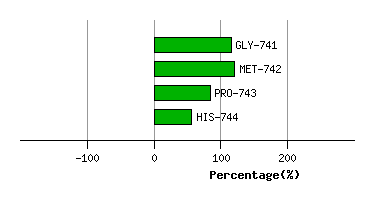
Graph shows rotational transition at bending residues and can be used
to identify hinge bending residues.
Probably only informative for interdomain rotations greater than 20 degrees
Residue
iResidue
i+1Distance of hinge axis to residue i in
(A) Distance of hinge axis to residue i in
(A) Change in
(deg) Change in
(deg) Angle of psi(i) axis to hinge axis
(deg) Angle of psi(i) axis to hinge axis
(deg) Percentage Progress
PRO-743
HIS-744
2.0
2.0
-1.0
2.4
30.6
31.5
41.4
PRO-743
HIS-744
2.0
2.0
-1.0
2.4
30.6
31.5
41.4
HIS-744
GLY-745
2.6
2.5
-1.7
1.9
45.6
44.8
-23.8
GLY-745
GLY-746
1.1
1.1
3.2
-7.2
144.8
146.1
38.6
GLY-746
HIS-747
2.3
2.5
6.1
-4.6
138.8
138.6
-21.6
HIS-747
VAL-748
2.6
2.6
2.3
3.8
143.0
141.7
-43.5
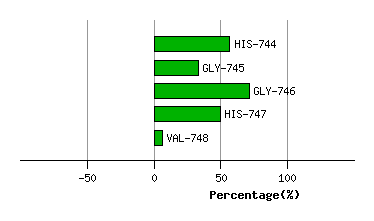
Graph shows rotational transition at bending residues and can be used
to identify hinge bending residues.
Probably only informative for interdomain rotations greater than 20 degrees