Pyruvate Kinase
(All numbering and residues are taken from first PDB file)
![]()
![]()
Bending Residue Dihedral Analysis
Residue
iResidue
i+1Distance of hinge axis to residue i in
(A) Distance of hinge axis to residue i in
(A) Change in
(deg) Change in
(deg) Angle of psi(i) axis to hinge axis
(deg) Angle of psi(i) axis to hinge axis
(deg) Percentage Progress
THR-1913
LYS-1914
10.5
10.8
-6.8
-7.3
113.4
117.2
-24.4
LYS-1914
GLY-1915
7.7
8.4
10.3
10.8
77.5
81.5
21.6
GLY-1915
PRO-1916
4.9
5.1
-25.7
12.6
97.1
87.5
12.8
PRO-1916
GLU-1917
1.2
1.4
72.1
-21.0
39.2
41.6
95.3
GLU-1917
ILE-1918
3.2
3.4
2.8
-30.8
107.5
99.4
17.2
ILE-1918
ARG-1919
6.2
6.2
-19.2
12.9
107.8
110.7
3.6
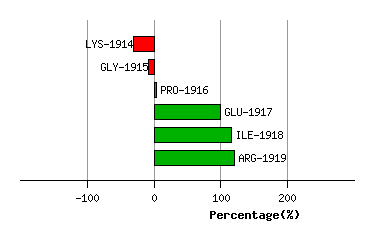
Graph shows rotational transition at bending residues and can be used
to identify hinge bending residues.
Probably only informative for interdomain rotations greater than 20 degrees
Residue
iResidue
i+1Distance of hinge axis to residue i in
(A) Distance of hinge axis to residue i in
(A) Change in
(deg) Change in
(deg) Angle of psi(i) axis to hinge axis
(deg) Angle of psi(i) axis to hinge axis
(deg) Percentage Progress
VAL-2008
ASN-2009
7.8
7.6
17.2
-16.4
100.7
100.0
30.4
ASN-2009
LEU-2010
5.4
5.4
-1.8
18.9
76.7
77.3
-21.2
LEU-2010
PRO-2011
7.2
7.6
36.5
-27.2
113.5
127.5
-14.4
PRO-2011
GLY-2012
6.4
7.5
8.7
-16.0
90.3
86.8
-11.8
GLY-2012
ALA-2013
9.5
10.0
-11.0
25.5
148.5
151.5
39.7
ALA-2013
ALA-2014
9.8
10.5
0.0
-4.9
140.5
131.1
-18.3
ALA-2014
VAL-2015
10.2
11.0
-12.2
50.3
131.6
141.8
51.2
VAL-2015
ASP-2016
7.1
8.1
35.6
9.2
50.4
32.2
119.4
ASP-2016
LEU-2017
7.0
8.8
-111.0
63.5
128.3
122.4
-115.2
LEU-2017
PRO-2018
3.5
5.1
-12.7
27.8
105.2
110.7
2.3
PRO-2018
ALA-2019
3.9
5.0
-4.6
1.4
59.8
52.3
7.5
ALA-2019
VAL-2020
5.8
6.9
-15.2
17.4
116.7
94.2
3.8
VAL-2020
SER-2021
5.5
6.0
20.9
-1.8
50.4
57.8
19.6
SER-2021
GLU-2022
3.0
3.3
6.6
-7.7
40.6
39.3
8.9
GLU-2022
LYS-2023
4.3
4.6
-4.7
6.4
69.5
76.8
0.4
LYS-2023
ASP-2024
7.0
7.7
4.6
-8.4
113.3
104.6
12.5
ASP-2024
ILE-2025
7.6
8.3
-13.3
0.7
136.7
139.0
-20.6
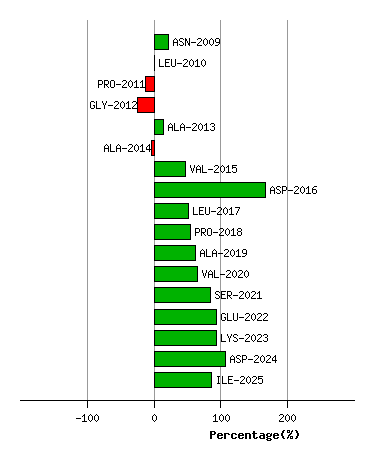
Graph shows rotational transition at bending residues and can be used
to identify hinge bending residues.
Probably only informative for interdomain rotations greater than 20 degrees