Protein Maf
(All numbering and residues are taken from first PDB file)
![]()
![]()
Bending Residue Dihedral Analysis
Residue
iResidue
i+1Distance of hinge axis to residue i in
(A) Distance of hinge axis to residue i in
(A) Change in
(deg) Change in
(deg) Angle of psi(i) axis to hinge axis
(deg) Angle of psi(i) axis to hinge axis
(deg) Percentage Progress
GLU-78
CYS-79
4.8
5.0
2.9
-6.5
144.7
142.3
33.7
CYS-79
LEU-80
5.6
5.5
-5.3
5.0
98.5
99.0
49.5
LEU-80
GLY-81
5.3
5.1
-16.8
14.5
69.0
68.9
75.1
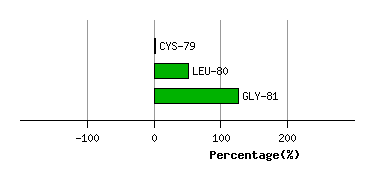
Graph shows rotational transition at bending residues and can be used
to identify hinge bending residues.
Probably only informative for interdomain rotations greater than 20 degrees
Residue
iResidue
i+1Distance of hinge axis to residue i in
(A) Distance of hinge axis to residue i in
(A) Change in
(deg) Change in
(deg) Angle of psi(i) axis to hinge axis
(deg) Angle of psi(i) axis to hinge axis
(deg) Percentage Progress
SER-91
MET-92
9.3
9.3
-3.9
-2.4
117.1
111.6
-90.1
MET-92
LEU-93
6.2
5.9
17.0
-1.9
36.9
26.9
167.4
LEU-93
ARG-94
7.4
7.2
17.9
-20.4
103.4
98.4
14.2
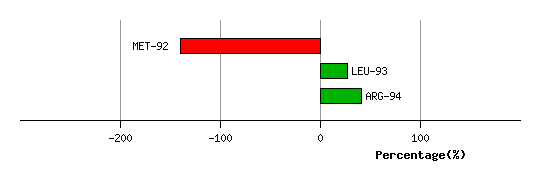
Graph shows rotational transition at bending residues and can be used
to identify hinge bending residues.
Probably only informative for interdomain rotations greater than 20 degrees
Residue
iResidue
i+1Distance of hinge axis to residue i in
(A) Distance of hinge axis to residue i in
(A) Change in
(deg) Change in
(deg) Angle of psi(i) axis to hinge axis
(deg) Angle of psi(i) axis to hinge axis
(deg) Percentage Progress
GLU-133
ILE-134
15.3
15.0
8.9
-4.6
56.1
63.5
8.4
ILE-134
TRP-135
13.4
13.2
-3.1
7.9
99.8
93.8
11.3
TRP-135
THR-136
16.5
16.4
2.2
-1.6
143.6
149.4
7.8
THR-136
TYR-137
17.8
17.5
7.6
-7.3
109.3
108.7
6.5
TYR-137
ILE-138
14.6
14.3
3.9
7.5
53.8
54.2
77.3
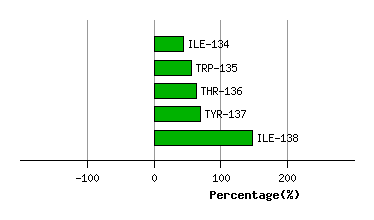
Graph shows rotational transition at bending residues and can be used
to identify hinge bending residues.
Probably only informative for interdomain rotations greater than 20 degrees
Residue
iResidue
i+1Distance of hinge axis to residue i in
(A) Distance of hinge axis to residue i in
(A) Change in
(deg) Change in
(deg) Angle of psi(i) axis to hinge axis
(deg) Angle of psi(i) axis to hinge axis
(deg) Percentage Progress
ALA-147
GLY-148
8.8
9.0
14.1
8.9
77.9
75.0
72.5
GLY-148
ALA-149
5.6
5.6
-10.0
10.5
106.5
97.5
-0.7
ALA-149
TYR-150
8.4
8.3
-13.4
8.1
156.4
157.5
-53.2
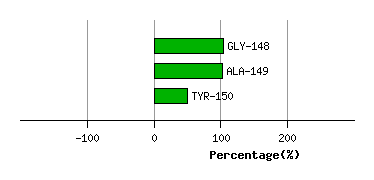
Graph shows rotational transition at bending residues and can be used
to identify hinge bending residues.
Probably only informative for interdomain rotations greater than 20 degrees