Baseplate Structural Protein Gp8
(All numbering and residues are taken from first PDB file)
![]()
![]()
Bending Residue Dihedral Analysis
Residue
iResidue
i+1Distance of hinge axis to residue i in
(A) Distance of hinge axis to residue i in
(A) Change in
(deg) Change in
(deg) Angle of psi(i) axis to hinge axis
(deg) Angle of psi(i) axis to hinge axis
(deg) Percentage Progress
PRO-91
ARG-92
15.4
15.7
-15.3
11.4
66.8
66.6
-10.4
ARG-92
ARG-93
12.8
12.8
4.6
-7.7
118.3
121.7
48.5
ARG-93
ASP-94
12.9
12.7
2.0
0.0
108.3
106.5
6.1
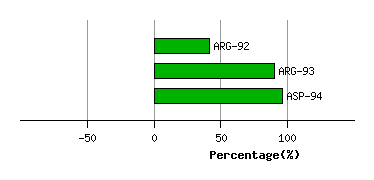
Graph shows rotational transition at bending residues and can be used
to identify hinge bending residues.
Probably only informative for interdomain rotations greater than 20 degrees
Residue
iResidue
i+1Distance of hinge axis to residue i in
(A) Distance of hinge axis to residue i in
(A) Change in
(deg) Change in
(deg) Angle of psi(i) axis to hinge axis
(deg) Angle of psi(i) axis to hinge axis
(deg) Percentage Progress
ASN-120
ALA-121
6.7
6.6
-14.6
15.9
71.2
78.1
-60.9
ALA-121
THR-122
5.1
5.6
-12.3
-5.9
62.7
55.0
109.3
THR-122
GLU-123
7.3
7.8
2.6
-10.2
107.9
113.9
58.7
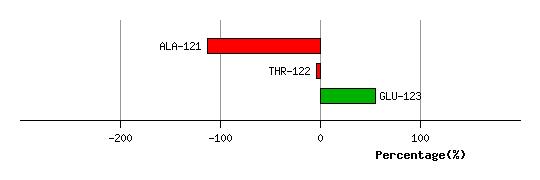
Graph shows rotational transition at bending residues and can be used
to identify hinge bending residues.
Probably only informative for interdomain rotations greater than 20 degrees
Residue
iResidue
i+1Distance of hinge axis to residue i in
(A) Distance of hinge axis to residue i in
(A) Change in
(deg) Change in
(deg) Angle of psi(i) axis to hinge axis
(deg) Angle of psi(i) axis to hinge axis
(deg) Percentage Progress
LEU-129
VAL-130
2.6
2.5
11.5
-10.4
75.2
81.0
-40.3
VAL-130
TYR-131
5.3
5.6
1.6
3.1
52.6
51.0
-4.0
TYR-131
ARG-132
8.3
8.3
-5.5
11.6
107.6
107.4
128.2
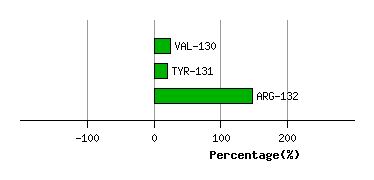
Graph shows rotational transition at bending residues and can be used
to identify hinge bending residues.
Probably only informative for interdomain rotations greater than 20 degrees
Residue
iResidue
i+1Distance of hinge axis to residue i in
(A) Distance of hinge axis to residue i in
(A) Change in
(deg) Change in
(deg) Angle of psi(i) axis to hinge axis
(deg) Angle of psi(i) axis to hinge axis
(deg) Percentage Progress
GLU-171
GLY-172
9.6
10.0
-11.8
4.5
32.4
34.3
84.7
GLY-172
ARG-173
9.1
8.9
10.8
-3.5
144.0
143.9
-78.1
ARG-173
GLY-174
8.1
7.9
37.2
-24.6
124.2
127.5
-110.9
GLY-174
ASP-175
11.5
11.1
-1.9
-29.0
28.8
39.3
420.0
ASP-175
ALA-176
13.3
12.7
11.8
14.6
128.0
130.6
-245.2
ALA-176
GLU-177
11.8
10.9
4.7
-16.9
76.6
84.3
62.4
ALA-176
GLU-177
11.8
10.9
4.7
-16.9
76.6
84.3
62.4
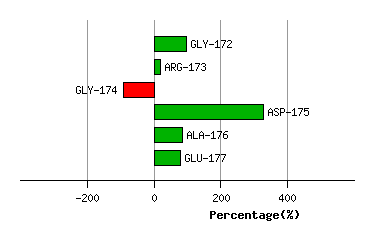
Graph shows rotational transition at bending residues and can be used
to identify hinge bending residues.
Probably only informative for interdomain rotations greater than 20 degrees
Residue
iResidue
i+1Distance of hinge axis to residue i in
(A) Distance of hinge axis to residue i in
(A) Change in
(deg) Change in
(deg) Angle of psi(i) axis to hinge axis
(deg) Angle of psi(i) axis to hinge axis
(deg) Percentage Progress
ALA-176
GLU-177
11.8
10.9
4.7
-16.9
76.6
84.3
62.4
ALA-176
GLU-177
11.8
10.9
4.7
-16.9
76.6
84.3
62.4
GLU-177
GLY-178
10.6
10.0
13.2
-18.1
148.1
155.7
68.4
GLY-178
THR-179
9.6
9.5
9.3
-3.4
119.2
115.2
-49.7
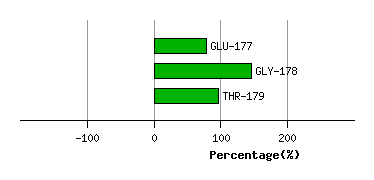
Graph shows rotational transition at bending residues and can be used
to identify hinge bending residues.
Probably only informative for interdomain rotations greater than 20 degrees
Residue
iResidue
i+1Distance of hinge axis to residue i in
(A) Distance of hinge axis to residue i in
(A) Change in
(deg) Change in
(deg) Angle of psi(i) axis to hinge axis
(deg) Angle of psi(i) axis to hinge axis
(deg) Percentage Progress
LEU-191
PHE-192
4.8
4.8
6.5
-9.8
84.8
86.6
48.1
PHE-192
GLU-193
1.6
1.5
7.9
-7.4
16.4
15.9
-10.2
GLU-193
ILE-194
1.2
1.4
-17.7
23.7
99.2
97.6
47.1
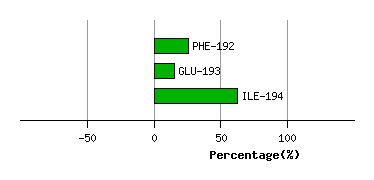
Graph shows rotational transition at bending residues and can be used
to identify hinge bending residues.
Probably only informative for interdomain rotations greater than 20 degrees
Residue
iResidue
i+1Distance of hinge axis to residue i in
(A) Distance of hinge axis to residue i in
(A) Change in
(deg) Change in
(deg) Angle of psi(i) axis to hinge axis
(deg) Angle of psi(i) axis to hinge axis
(deg) Percentage Progress
PRO-195
PRO-196
6.9
7.2
-16.7
20.9
31.9
27.3
-49.1
PRO-196
ASP-197
8.2
8.0
-15.9
1.6
91.3
88.2
70.0
ASP-197
VAL-198
11.7
11.6
-7.9
15.3
106.9
113.1
65.3
VAL-198
SER-199
10.7
10.9
8.2
2.5
47.9
49.2
123.3
VAL-198
SER-199
10.7
10.9
8.2
2.5
47.9
49.2
123.3
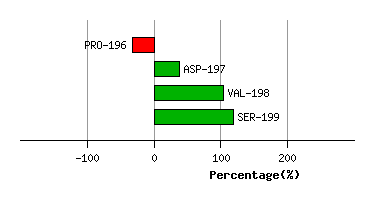
Graph shows rotational transition at bending residues and can be used
to identify hinge bending residues.
Probably only informative for interdomain rotations greater than 20 degrees
Residue
iResidue
i+1Distance of hinge axis to residue i in
(A) Distance of hinge axis to residue i in
(A) Change in
(deg) Change in
(deg) Angle of psi(i) axis to hinge axis
(deg) Angle of psi(i) axis to hinge axis
(deg) Percentage Progress
VAL-198
SER-199
10.7
10.9
8.2
2.5
47.9
49.2
123.3
VAL-198
SER-199
10.7
10.9
8.2
2.5
47.9
49.2
123.3
SER-199
ILE-200
8.5
9.1
-8.6
0.9
148.6
136.7
-146.5
ILE-200
ASN-201
10.4
11.4
-2.2
15.7
85.2
74.4
5.9
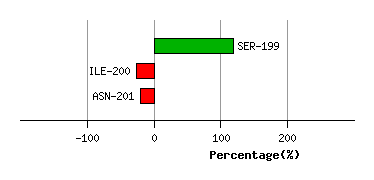
Graph shows rotational transition at bending residues and can be used
to identify hinge bending residues.
Probably only informative for interdomain rotations greater than 20 degrees
Residue
iResidue
i+1Distance of hinge axis to residue i in
(A) Distance of hinge axis to residue i in
(A) Change in
(deg) Change in
(deg) Angle of psi(i) axis to hinge axis
(deg) Angle of psi(i) axis to hinge axis
(deg) Percentage Progress
PRO-220
THR-221
6.7
6.4
-17.0
6.0
30.5
29.3
104.9
THR-221
ARG-222
8.0
7.6
1.2
-1.7
143.2
144.6
18.7
ARG-222
TRP-223
8.3
8.1
-4.0
7.5
74.9
72.2
17.7
TRP-223
GLY-224
4.8
4.7
-9.1
14.8
82.8
88.1
-41.2
TRP-223
GLY-224
4.8
4.7
-9.1
14.8
82.8
88.1
-41.2
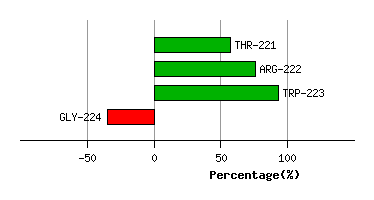
Graph shows rotational transition at bending residues and can be used
to identify hinge bending residues.
Probably only informative for interdomain rotations greater than 20 degrees
Residue
iResidue
i+1Distance of hinge axis to residue i in
(A) Distance of hinge axis to residue i in
(A) Change in
(deg) Change in
(deg) Angle of psi(i) axis to hinge axis
(deg) Angle of psi(i) axis to hinge axis
(deg) Percentage Progress
TRP-223
GLY-224
4.8
4.7
-9.1
14.8
82.8
88.1
-41.2
TRP-223
GLY-224
4.8
4.7
-9.1
14.8
82.8
88.1
-41.2
GLY-224
TYR-225
4.0
3.4
-10.9
11.9
36.5
33.5
17.0
TYR-225
GLU-226
2.8
2.2
-11.8
2.7
43.0
47.1
86.5
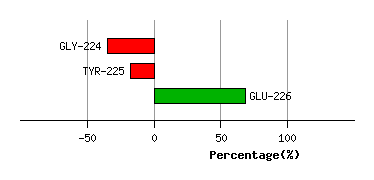
Graph shows rotational transition at bending residues and can be used
to identify hinge bending residues.
Probably only informative for interdomain rotations greater than 20 degrees