Xanthine Phosphoribosyltransferase
(All numbering and residues are taken from first PDB file)
![]()
![]()
Bending Residue Dihedral Analysis
Residue
iResidue
i+1Distance of hinge axis to residue i in
(A) Distance of hinge axis to residue i in
(A) Change in
(deg) Change in
(deg) Angle of psi(i) axis to hinge axis
(deg) Angle of psi(i) axis to hinge axis
(deg) Percentage Progress
VAL-76
VAL-77
14.0
14.2
-1.1
0.0
112.4
113.5
4.0
VAL-77
PHE-78
10.8
11.0
3.0
-6.7
23.7
25.3
-0.9
PHE-78
ALA-79
10.2
10.4
1.4
-1.2
72.7
71.0
-3.7
ALA-79
ARG-80
6.8
6.9
-5.5
-11.9
148.8
148.8
-62.7
ARG-80
LYS-81
7.0
7.3
13.4
29.8
48.4
55.7
104.6
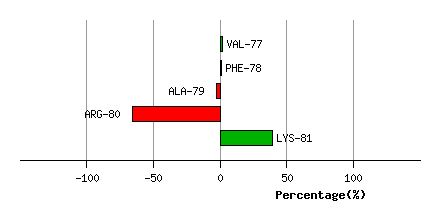
Graph shows rotational transition at bending residues and can be used
to identify hinge bending residues.
Probably only informative for interdomain rotations greater than 20 degrees
Residue
iResidue
i+1Distance of hinge axis to residue i in
(A) Distance of hinge axis to residue i in
(A) Change in
(deg) Change in
(deg) Angle of psi(i) axis to hinge axis
(deg) Angle of psi(i) axis to hinge axis
(deg) Percentage Progress
GLN-106
ILE-107
1.8
1.4
-2.1
10.6
111.3
117.3
36.6
ILE-107
ALA-108
1.4
2.0
5.2
-14.5
26.0
28.0
-51.0
ALA-108
VAL-109
3.1
3.2
11.3
-2.5
50.1
50.7
39.2
VAL-109
SER-110
4.5
4.9
-3.5
8.8
132.0
131.3
17.6
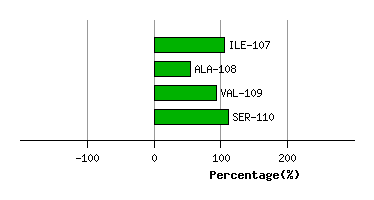
Graph shows rotational transition at bending residues and can be used
to identify hinge bending residues.
Probably only informative for interdomain rotations greater than 20 degrees