336Aa Long Hypothetical Dtdp-Glucose 4,6- Dehydratase
(All numbering and residues are taken from first PDB file)
![]()
![]()
Bending Residue Dihedral Analysis
Residue
iResidue
i+1Distance of hinge axis to residue i in
(A) Distance of hinge axis to residue i in
(A) Change in
(deg) Change in
(deg) Angle of psi(i) axis to hinge axis
(deg) Angle of psi(i) axis to hinge axis
(deg) Percentage Progress
GLY-202
LEU-203
8.3
8.8
-4.5
0.4
109.7
109.4
6.4
LEU-203
LYS-204
9.5
10.2
3.9
-0.5
21.1
15.7
7.5
LYS-204
ILE-205
11.7
12.1
16.2
2.7
45.6
52.9
98.2
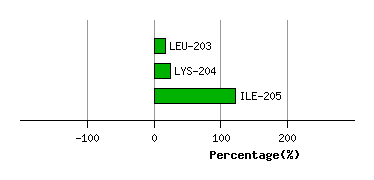
Graph shows rotational transition at bending residues and can be used
to identify hinge bending residues.
Probably only informative for interdomain rotations greater than 20 degrees
Residue
iResidue
i+1Distance of hinge axis to residue i in
(A) Distance of hinge axis to residue i in
(A) Change in
(deg) Change in
(deg) Angle of psi(i) axis to hinge axis
(deg) Angle of psi(i) axis to hinge axis
(deg) Percentage Progress
VAL-214
ARG-215
5.5
6.1
-42.6
-1.3
95.7
93.7
51.4
ARG-215
ASP-216
4.8
5.2
4.5
-0.5
86.5
90.3
4.2
ASP-216
TRP-217
4.0
4.3
-0.3
4.7
152.5
153.8
30.0
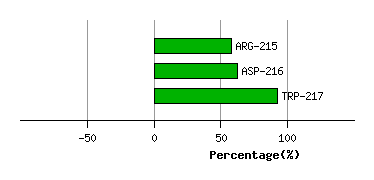
Graph shows rotational transition at bending residues and can be used
to identify hinge bending residues.
Probably only informative for interdomain rotations greater than 20 degrees
Residue
iResidue
i+1Distance of hinge axis to residue i in
(A) Distance of hinge axis to residue i in
(A) Change in
(deg) Change in
(deg) Angle of psi(i) axis to hinge axis
(deg) Angle of psi(i) axis to hinge axis
(deg) Percentage Progress
ILE-242
SER-243
13.1
13.1
-2.4
7.6
70.9
71.4
-0.7
SER-243
ALA-244
9.4
9.5
0.7
1.3
98.0
102.8
-9.8
ALA-244
GLY-245
8.3
8.4
-4.2
7.3
122.6
121.0
4.0
GLY-245
GLU-246
5.6
5.9
-5.9
0.0
51.7
50.6
25.8
GLU-246
GLU-247
3.8
3.9
-3.2
-0.9
84.4
87.7
1.0
GLU-247
LYS-248
0.1
0.4
2.5
-1.5
117.9
115.3
7.2
LYS-248
THR-249
2.6
2.6
-4.3
13.3
71.6
77.0
-1.1
THR-249
ASN-250
5.9
6.0
-2.7
-4.0
5.4
11.3
40.4
ASN-250
LEU-251
6.4
6.6
6.5
-3.8
115.6
122.5
4.6
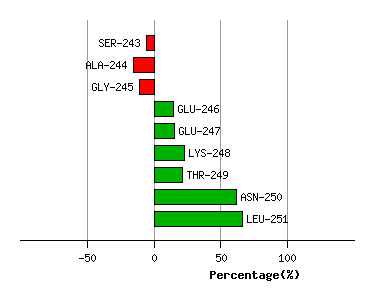
Graph shows rotational transition at bending residues and can be used
to identify hinge bending residues.
Probably only informative for interdomain rotations greater than 20 degrees
Residue
iResidue
i+1Distance of hinge axis to residue i in
(A) Distance of hinge axis to residue i in
(A) Change in
(deg) Change in
(deg) Angle of psi(i) axis to hinge axis
(deg) Angle of psi(i) axis to hinge axis
(deg) Percentage Progress
GLY-276
HIS-277
18.0
19.9
-22.9
37.2
105.3
83.2
-44.6
HIS-277
ASP-278
14.3
16.1
99.3
11.2
137.1
146.6
-487.2
ASP-278
LEU-279
13.9
14.2
149.0
46.2
136.4
86.8
587.2
LEU-279
ARG-280
12.1
11.8
159.9
-39.5
86.0
90.7
-16.2
ARG-280
TYR-281
8.6
8.6
-2.9
4.9
70.9
71.6
-14.1
TYR-281
SER-282
8.5
8.3
1.3
-3.2
100.9
103.2
21.3
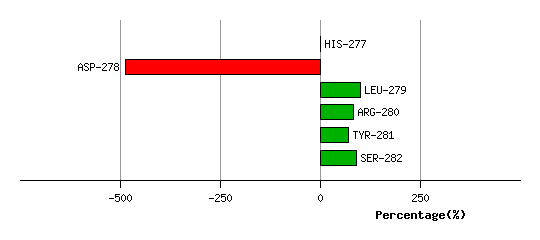
Graph shows rotational transition at bending residues and can be used
to identify hinge bending residues.
Probably only informative for interdomain rotations greater than 20 degrees