Eosinophil Cationic Protein
(All numbering and residues are taken from first PDB file)
![]()
![]()
Bending Residue Dihedral Analysis
Residue
iResidue
i+1Distance of hinge axis to residue i in
(A) Distance of hinge axis to residue i in
(A) Change in
(deg) Change in
(deg) Angle of psi(i) axis to hinge axis
(deg) Angle of psi(i) axis to hinge axis
(deg) Percentage Progress
ASN-19
PRO-20
12.7
12.2
-11.1
0.7
36.0
34.6
71.0
PRO-20
PRO-21
9.7
9.2
-5.2
12.1
33.4
45.5
-46.8
PRO-21
ARG-22
9.9
9.4
0.6
-4.2
96.8
89.3
3.9
ARG-22
CYS-23
7.8
7.6
2.5
9.7
82.8
91.3
10.7
CYS-23
THR-24
4.1
3.8
-3.9
-1.1
35.7
33.8
25.8
THR-24
ILE-25
2.9
2.7
2.4
-4.3
100.5
103.4
-7.1
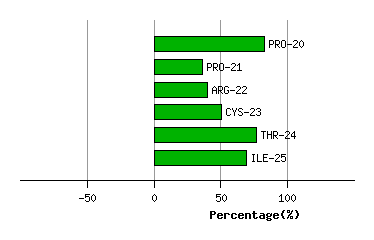
Graph shows rotational transition at bending residues and can be used
to identify hinge bending residues.
Probably only informative for interdomain rotations greater than 20 degrees
Residue
iResidue
i+1Distance of hinge axis to residue i in
(A) Distance of hinge axis to residue i in
(A) Change in
(deg) Change in
(deg) Angle of psi(i) axis to hinge axis
(deg) Angle of psi(i) axis to hinge axis
(deg) Percentage Progress
ASN-39
GLN-40
8.1
8.2
11.2
-4.7
124.2
129.4
-33.7
GLN-40
ASN-41
5.7
5.8
11.6
-15.6
117.1
115.6
14.7
ASN-41
THR-42
2.7
3.0
-3.6
6.5
61.3
63.9
29.0
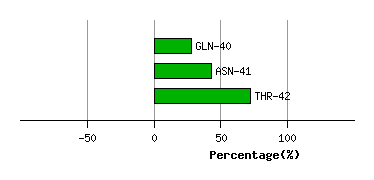
Graph shows rotational transition at bending residues and can be used
to identify hinge bending residues.
Probably only informative for interdomain rotations greater than 20 degrees
Residue
iResidue
i+1Distance of hinge axis to residue i in
(A) Distance of hinge axis to residue i in
(A) Change in
(deg) Change in
(deg) Angle of psi(i) axis to hinge axis
(deg) Angle of psi(i) axis to hinge axis
(deg) Percentage Progress
PRO-79
LEU-80
9.0
8.9
1.6
-20.0
125.5
122.2
125.3
LEU-80
LEU-81
6.3
6.1
2.7
-2.4
158.8
149.4
-40.2
LEU-81
HIS-82
5.8
5.4
6.2
-7.3
103.9
98.7
52.2
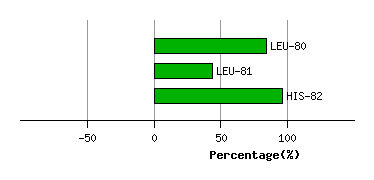
Graph shows rotational transition at bending residues and can be used
to identify hinge bending residues.
Probably only informative for interdomain rotations greater than 20 degrees
Residue
iResidue
i+1Distance of hinge axis to residue i in
(A) Distance of hinge axis to residue i in
(A) Change in
(deg) Change in
(deg) Angle of psi(i) axis to hinge axis
(deg) Angle of psi(i) axis to hinge axis
(deg) Percentage Progress
ALA-99
ASP-100
7.3
7.3
-0.4
-0.6
33.6
37.9
-5.9
ASP-100
ARG-101
7.6
7.3
2.1
0.0
134.8
140.2
46.7
ARG-101
PRO-102
8.9
8.4
-18.0
-1.3
30.6
44.7
102.7
PRO-102
GLY-103
9.8
9.0
0.9
-7.3
142.7
152.2
40.4
GLY-103
ARG-104
9.2
9.2
8.7
12.2
140.8
133.5
-110.5
ARG-104
ARG-105
8.8
8.8
-6.7
20.2
39.0
47.4
-71.8
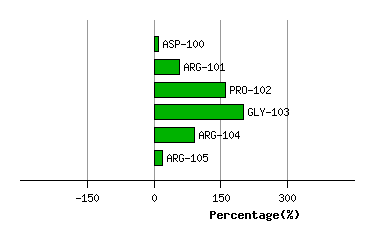
Graph shows rotational transition at bending residues and can be used
to identify hinge bending residues.
Probably only informative for interdomain rotations greater than 20 degrees