O-Succinylbenzoic Acid Synthetase
(All numbering and residues are taken from first PDB file)
![]()
![]()
Bending Residue Dihedral Analysis
Residue
iResidue
i+1Distance of hinge axis to residue i in
(A) Distance of hinge axis to residue i in
(A) Change in
(deg) Change in
(deg) Angle of psi(i) axis to hinge axis
(deg) Angle of psi(i) axis to hinge axis
(deg) Percentage Progress
PHE-117
SER-118
14.7
15.0
-3.3
-6.1
53.4
52.8
95.1
SER-118
VAL-119
13.0
13.5
-9.3
9.5
66.8
61.3
3.2
VAL-119
ALA-120
9.9
10.5
-10.6
-3.4
33.5
31.7
116.2
ALA-120
TYR-121
8.7
9.5
-10.5
14.1
81.9
85.5
46.3
ALA-120
TYR-121
8.7
9.5
-10.5
14.1
81.9
85.5
46.3
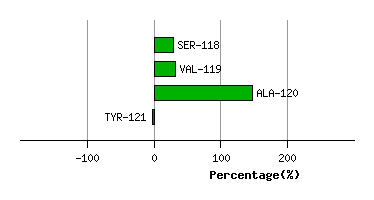
Graph shows rotational transition at bending residues and can be used
to identify hinge bending residues.
Probably only informative for interdomain rotations greater than 20 degrees
Residue
iResidue
i+1Distance of hinge axis to residue i in
(A) Distance of hinge axis to residue i in
(A) Change in
(deg) Change in
(deg) Angle of psi(i) axis to hinge axis
(deg) Angle of psi(i) axis to hinge axis
(deg) Percentage Progress
ALA-120
TYR-121
8.7
9.5
-10.5
14.1
81.9
85.5
46.3
ALA-120
TYR-121
8.7
9.5
-10.5
14.1
81.9
85.5
46.3
TYR-121
GLY-122
7.7
7.6
0.1
7.2
44.4
52.2
49.7
GLY-122
ALA-123
4.7
4.0
-19.6
3.4
82.5
80.6
19.8
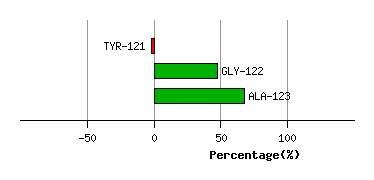
Graph shows rotational transition at bending residues and can be used
to identify hinge bending residues.
Probably only informative for interdomain rotations greater than 20 degrees
Residue
iResidue
i+1Distance of hinge axis to residue i in
(A) Distance of hinge axis to residue i in
(A) Change in
(deg) Change in
(deg) Angle of psi(i) axis to hinge axis
(deg) Angle of psi(i) axis to hinge axis
(deg) Percentage Progress
ILE-144
LYS-145
3.8
3.3
9.1
-2.9
85.4
89.2
21.0
LYS-145
LEU-146
4.3
3.8
14.6
-4.8
105.8
105.7
15.4
LEU-146
LYS-147
7.5
7.2
3.6
3.1
76.9
67.7
-11.0
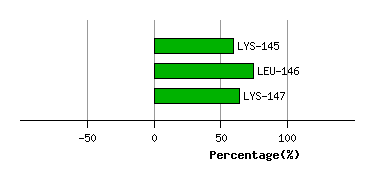
Graph shows rotational transition at bending residues and can be used
to identify hinge bending residues.
Probably only informative for interdomain rotations greater than 20 degrees
Residue
iResidue
i+1Distance of hinge axis to residue i in
(A) Distance of hinge axis to residue i in
(A) Change in
(deg) Change in
(deg) Angle of psi(i) axis to hinge axis
(deg) Angle of psi(i) axis to hinge axis
(deg) Percentage Progress
LEU-159
ARG-160
8.0
8.0
-9.2
7.6
121.8
120.2
23.0
ARG-160
GLU-161
5.9
6.0
4.7
13.2
56.1
58.8
57.8
GLU-161
LEU-162
9.3
9.6
-8.7
4.7
49.7
59.5
83.3
LEU-162
ASP-163
10.6
10.6
20.7
-24.5
89.1
65.1
-0.6
ASP-163
PHE-164
12.6
11.8
-30.0
42.7
54.1
68.0
-93.7
PHE-164
HIS-165
10.8
10.7
4.3
11.9
89.0
90.7
-4.2
HIS-165
PHE-166
7.9
8.1
-2.3
0.0
20.9
19.0
16.5
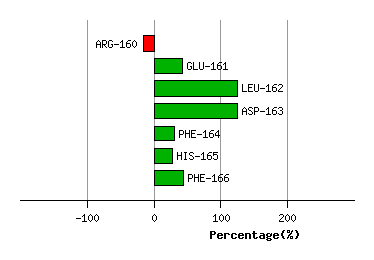
Graph shows rotational transition at bending residues and can be used
to identify hinge bending residues.
Probably only informative for interdomain rotations greater than 20 degrees
Residue
iResidue
i+1Distance of hinge axis to residue i in
(A) Distance of hinge axis to residue i in
(A) Change in
(deg) Change in
(deg) Angle of psi(i) axis to hinge axis
(deg) Angle of psi(i) axis to hinge axis
(deg) Percentage Progress
PHE-245
ARG-246
7.3
7.5
3.8
-10.3
83.3
76.3
-8.5
ARG-246
LEU-247
10.7
10.7
-14.9
6.1
77.3
72.0
62.3
LEU-247
GLY-248
12.1
12.0
-15.3
6.3
13.4
7.5
90.9
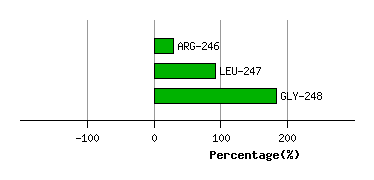
Graph shows rotational transition at bending residues and can be used
to identify hinge bending residues.
Probably only informative for interdomain rotations greater than 20 degrees
Residue
iResidue
i+1Distance of hinge axis to residue i in
(A) Distance of hinge axis to residue i in
(A) Change in
(deg) Change in
(deg) Angle of psi(i) axis to hinge axis
(deg) Angle of psi(i) axis to hinge axis
(deg) Percentage Progress
ILE-250
ASP-251
8.6
8.5
-0.5
8.3
85.8
85.1
-14.6
ASP-251
LYS-252
12.2
12.1
-29.8
30.7
57.7
49.2
-4.2
LYS-252
VAL-253
13.4
13.1
-34.3
10.1
8.4
18.5
229.6
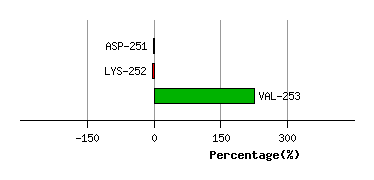
Graph shows rotational transition at bending residues and can be used
to identify hinge bending residues.
Probably only informative for interdomain rotations greater than 20 degrees
Residue
iResidue
i+1Distance of hinge axis to residue i in
(A) Distance of hinge axis to residue i in
(A) Change in
(deg) Change in
(deg) Angle of psi(i) axis to hinge axis
(deg) Angle of psi(i) axis to hinge axis
(deg) Percentage Progress
VAL-268
ILE-269
7.3
7.4
11.5
-26.9
157.6
156.8
97.8
ILE-269
GLY-270
5.8
5.6
9.4
-5.8
84.6
89.1
-37.3
GLY-270
GLY-271
3.1
2.9
-18.3
11.5
26.8
28.2
59.3
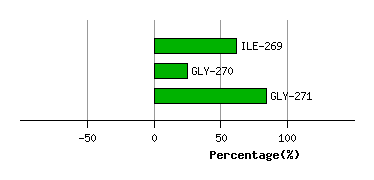
Graph shows rotational transition at bending residues and can be used
to identify hinge bending residues.
Probably only informative for interdomain rotations greater than 20 degrees
Residue
iResidue
i+1Distance of hinge axis to residue i in
(A) Distance of hinge axis to residue i in
(A) Change in
(deg) Change in
(deg) Angle of psi(i) axis to hinge axis
(deg) Angle of psi(i) axis to hinge axis
(deg) Percentage Progress
ALA-283
MET-284
6.0
6.2
-6.7
14.0
99.2
101.6
-21.3
MET-284
LEU-285
8.9
9.0
-7.9
7.9
68.2
66.9
53.3
LEU-285
ALA-286
8.7
8.7
-18.2
-3.4
6.3
3.9
197.8
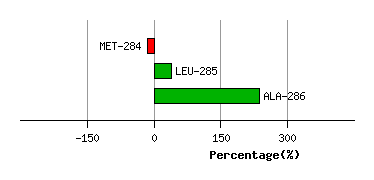
Graph shows rotational transition at bending residues and can be used
to identify hinge bending residues.
Probably only informative for interdomain rotations greater than 20 degrees
Residue
iResidue
i+1Distance of hinge axis to residue i in
(A) Distance of hinge axis to residue i in
(A) Change in
(deg) Change in
(deg) Angle of psi(i) axis to hinge axis
(deg) Angle of psi(i) axis to hinge axis
(deg) Percentage Progress
PRO-292
GLY-293
6.8
5.4
-4.3
-12.5
59.1
57.8
95.1
GLY-293
ASP-294
4.5
3.3
3.3
12.6
76.9
87.2
18.0
ASP-294
VAL-295
0.7
0.4
-13.8
-14.8
34.7
34.2
180.7
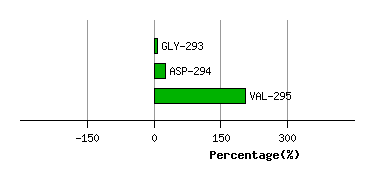
Graph shows rotational transition at bending residues and can be used
to identify hinge bending residues.
Probably only informative for interdomain rotations greater than 20 degrees