Proto-Oncogene Tyrosine-Protein Kinase
(All numbering and residues are taken from first PDB file)
![]()
![]()
Bending Residue Dihedral Analysis
Residue
iResidue
i+1Distance of hinge axis to residue i in
(A) Distance of hinge axis to residue i in
(A) Change in
(deg) Change in
(deg) Angle of psi(i) axis to hinge axis
(deg) Angle of psi(i) axis to hinge axis
(deg) Percentage Progress
LYS-276
GLN-277
18.4
18.1
4.6
-16.6
141.0
145.5
70.2
GLN-277
GLY-278
19.3
18.5
-23.0
43.6
97.8
77.7
-4.1
ALA-284
PHE-285
17.1
16.9
-13.3
-18.7
119.7
140.2
-96.6
PHE-285
LEU-286
14.2
14.2
16.1
7.2
99.7
92.5
16.9
LEU-286
ALA-287
11.6
11.6
3.9
-8.9
73.2
63.3
11.3
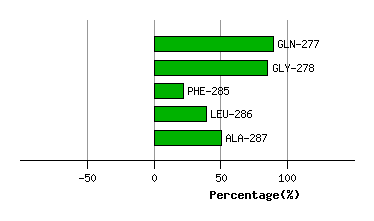
Graph shows rotational transition at bending residues and can be used
to identify hinge bending residues.
Probably only informative for interdomain rotations greater than 20 degrees
Residue
iResidue
i+1Distance of hinge axis to residue i in
(A) Distance of hinge axis to residue i in
(A) Change in
(deg) Change in
(deg) Angle of psi(i) axis to hinge axis
(deg) Angle of psi(i) axis to hinge axis
(deg) Percentage Progress
ALA-305
VAL-306
0.5
1.1
5.8
4.2
79.9
83.0
20.9
VAL-306
VAL-307
3.7
4.1
22.1
2.2
34.2
36.1
108.7
VAL-307
THR-308
6.0
6.0
19.4
-12.3
74.4
67.3
8.3
THR-308
GLN-309
7.9
7.5
5.0
-9.6
58.4
60.8
-12.3
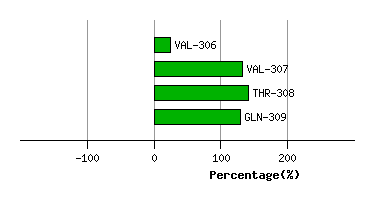
Graph shows rotational transition at bending residues and can be used
to identify hinge bending residues.
Probably only informative for interdomain rotations greater than 20 degrees
Residue
iResidue
i+1Distance of hinge axis to residue i in
(A) Distance of hinge axis to residue i in
(A) Change in
(deg) Change in
(deg) Angle of psi(i) axis to hinge axis
(deg) Angle of psi(i) axis to hinge axis
(deg) Percentage Progress
TYR-318
MET-319
4.1
4.5
-8.3
26.2
160.1
158.9
93.3
MET-319
GLU-320
3.4
3.8
7.5
-3.1
55.8
61.8
-28.5
GLU-320
ASN-321
6.5
7.0
8.2
4.2
40.8
37.8
42.7
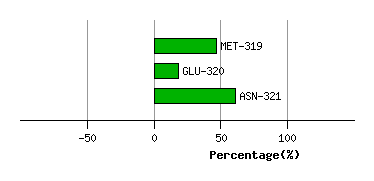
Graph shows rotational transition at bending residues and can be used
to identify hinge bending residues.
Probably only informative for interdomain rotations greater than 20 degrees