Exopolyphosphatase
(All numbering and residues are taken from first PDB file)
![]()
![]()
Bending Residue Dihedral Analysis
Residue
iResidue
i+1Distance of hinge axis to residue i in
(A) Distance of hinge axis to residue i in
(A) Change in
(deg) Change in
(deg) Angle of psi(i) axis to hinge axis
(deg) Angle of psi(i) axis to hinge axis
(deg) Percentage Progress
LEU-124
ILE-125
7.4
7.5
-0.3
-1.1
59.8
59.6
5.6
ILE-125
PHE-126
9.7
9.8
0.5
-3.2
96.6
95.7
14.8
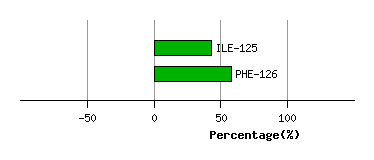
Graph shows rotational transition at bending residues and can be used
to identify hinge bending residues.
Probably only informative for interdomain rotations greater than 20 degrees
Residue
iResidue
i+1Distance of hinge axis to residue i in
(A) Distance of hinge axis to residue i in
(A) Change in
(deg) Change in
(deg) Angle of psi(i) axis to hinge axis
(deg) Angle of psi(i) axis to hinge axis
(deg) Percentage Progress
VAL-129
GLU-130
15.5
15.6
3.6
-6.0
113.2
115.9
29.7
GLU-130
HIS-131
16.5
16.5
-1.2
5.4
34.6
37.4
-40.4
HIS-131
THR-132
17.3
17.4
3.9
-23.7
83.8
81.3
47.9
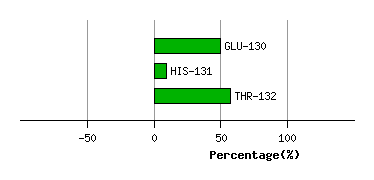
Graph shows rotational transition at bending residues and can be used
to identify hinge bending residues.
Probably only informative for interdomain rotations greater than 20 degrees
Residue
iResidue
i+1Distance of hinge axis to residue i in
(A) Distance of hinge axis to residue i in
(A) Change in
(deg) Change in
(deg) Angle of psi(i) axis to hinge axis
(deg) Angle of psi(i) axis to hinge axis
(deg) Percentage Progress
GLY-154
GLU-155
14.2
14.1
-3.4
-4.1
101.5
101.3
-157.6
GLU-155
ASN-156
17.5
17.3
15.9
4.9
6.3
15.6
329.2
ASN-156
PHE-157
18.6
18.6
-8.3
5.1
124.3
122.4
-16.2
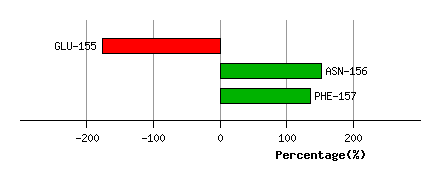
Graph shows rotational transition at bending residues and can be used
to identify hinge bending residues.
Probably only informative for interdomain rotations greater than 20 degrees
Residue
iResidue
i+1Distance of hinge axis to residue i in
(A) Distance of hinge axis to residue i in
(A) Change in
(deg) Change in
(deg) Angle of psi(i) axis to hinge axis
(deg) Angle of psi(i) axis to hinge axis
(deg) Percentage Progress
GLU-158
PRO-159
14.2
13.8
7.5
-5.4
22.8
19.6
35.5
PRO-159
ILE-160
11.6
11.5
2.5
5.3
64.2
67.0
88.4
ILE-160
LEU-161
12.9
12.8
0.4
1.2
56.5
55.9
-5.0
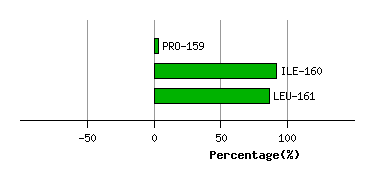
Graph shows rotational transition at bending residues and can be used
to identify hinge bending residues.
Probably only informative for interdomain rotations greater than 20 degrees
Residue
iResidue
i+1Distance of hinge axis to residue i in
(A) Distance of hinge axis to residue i in
(A) Change in
(deg) Change in
(deg) Angle of psi(i) axis to hinge axis
(deg) Angle of psi(i) axis to hinge axis
(deg) Percentage Progress
LEU-302
TYR-303
12.2
12.7
-0.6
5.6
109.5
108.7
18.6
TYR-303
GLU-304
12.4
12.7
-3.3
-6.3
108.7
111.1
-47.1
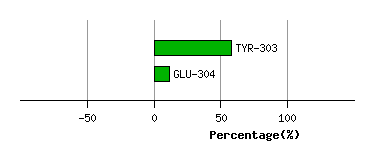
Graph shows rotational transition at bending residues and can be used
to identify hinge bending residues.
Probably only informative for interdomain rotations greater than 20 degrees
Residue
iResidue
i+1Distance of hinge axis to residue i in
(A) Distance of hinge axis to residue i in
(A) Change in
(deg) Change in
(deg) Angle of psi(i) axis to hinge axis
(deg) Angle of psi(i) axis to hinge axis
(deg) Percentage Progress
GLY-307
ARG-308
10.8
10.4
-1.9
-10.6
51.4
47.2
163.8
ARG-308
PHE-309
7.5
7.2
10.6
4.9
162.3
154.3
-208.7
PHE-309
ARG-310
9.0
9.4
0.5
-10.5
109.4
118.4
119.8
ARG-310
HIS-311
11.5
10.9
4.7
-7.8
83.8
92.7
5.1
HIS-311
GLN-312
9.4
8.0
15.4
-17.3
31.0
42.4
-10.1
GLN-312
ASP-313
10.4
9.0
25.9
-21.4
63.0
52.9
136.4
ASP-313
VAL-314
7.4
6.6
-4.2
4.3
140.7
133.7
-31.1
VAL-314
ARG-315
8.1
7.8
7.1
-7.0
88.5
84.5
-55.8
ARG-315
SER-316
6.8
6.5
0.9
1.3
112.9
112.0
32.1
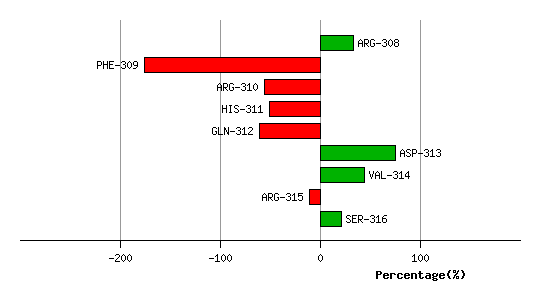
Graph shows rotational transition at bending residues and can be used
to identify hinge bending residues.
Probably only informative for interdomain rotations greater than 20 degrees
Residue
iResidue
i+1Distance of hinge axis to residue i in
(A) Distance of hinge axis to residue i in
(A) Change in
(deg) Change in
(deg) Angle of psi(i) axis to hinge axis
(deg) Angle of psi(i) axis to hinge axis
(deg) Percentage Progress
LEU-394
PRO-395
6.6
6.6
7.1
-0.7
107.6
107.0
-50.2
PRO-395
GLY-396
5.1
5.0
-3.4
-0.4
15.8
18.0
51.6
GLY-396
PHE-397
3.0
2.9
9.8
-5.7
107.1
108.2
-23.0
PHE-397
ASN-398
2.7
2.8
-0.8
-1.1
121.4
118.3
-5.6
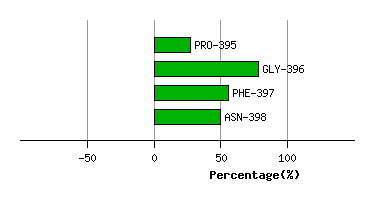
Graph shows rotational transition at bending residues and can be used
to identify hinge bending residues.
Probably only informative for interdomain rotations greater than 20 degrees