Nickel-Binding Periplasmic Protein
(All numbering and residues are taken from first PDB file)
![]()
![]()
Bending Residue Dihedral Analysis
Residue
iResidue
i+1Distance of hinge axis to residue i in
(A) Distance of hinge axis to residue i in
(A) Change in
(deg) Change in
(deg) Angle of psi(i) axis to hinge axis
(deg) Angle of psi(i) axis to hinge axis
(deg) Percentage Progress
ILE-166
LEU-167
17.5
17.8
-0.1
-1.9
148.2
148.3
0.3
LEU-167
GLN-168
18.6
18.9
9.5
17.3
63.5
65.3
56.3
GLN-168
GLU-169
20.5
21.1
-174.5
107.2
130.4
105.7
-190.0
GLU-169
SER-170
21.5
24.5
-31.5
64.7
100.9
155.2
90.9
SER-170
LYS-171
21.4
24.2
-6.8
19.8
140.4
136.4
175.2
LYS-171
LEU-172
22.6
25.5
-161.4
-78.2
94.4
131.0
288.4
LEU-172
ASN-173
23.7
23.8
1.3
-126.3
37.2
116.9
-188.3
ASN-173
GLN-174
21.7
23.1
-30.9
49.9
123.2
106.1
109.5
GLN-174
TYR-175
19.3
19.9
54.2
25.2
122.6
120.1
-485.3
TYR-175
ASP-176
17.4
18.0
-33.1
18.3
25.6
13.3
164.8
ASP-176
VAL-177
17.2
17.6
-14.2
0.3
87.8
82.7
10.6
VAL-177
PHE-178
16.3
16.6
-1.3
-0.3
16.6
17.7
-23.0
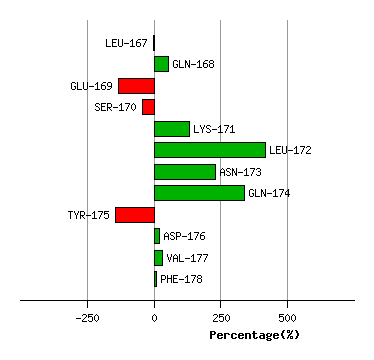
Graph shows rotational transition at bending residues and can be used
to identify hinge bending residues.
Probably only informative for interdomain rotations greater than 20 degrees
Residue
iResidue
i+1Distance of hinge axis to residue i in
(A) Distance of hinge axis to residue i in
(A) Change in
(deg) Change in
(deg) Angle of psi(i) axis to hinge axis
(deg) Angle of psi(i) axis to hinge axis
(deg) Percentage Progress
ILE-194
THR-195
11.1
11.4
-1.1
1.3
115.9
118.6
41.2
THR-195
PHE-196
12.5
12.8
-5.7
3.6
95.6
97.5
12.2
PHE-196
ASN-197
12.4
12.9
-3.5
7.9
142.6
142.7
-2.9
ASN-197
VAL-198
13.4
13.9
-8.0
-2.6
77.5
75.9
-18.3
VAL-198
ILE-199
16.0
16.4
-2.3
11.7
139.9
150.4
50.6
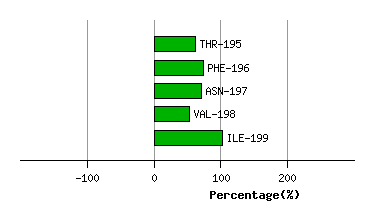
Graph shows rotational transition at bending residues and can be used
to identify hinge bending residues.
Probably only informative for interdomain rotations greater than 20 degrees
Residue
iResidue
i+1Distance of hinge axis to residue i in
(A) Distance of hinge axis to residue i in
(A) Change in
(deg) Change in
(deg) Angle of psi(i) axis to hinge axis
(deg) Angle of psi(i) axis to hinge axis
(deg) Percentage Progress
THR-211
GLY-212
3.3
3.5
15.7
8.1
62.5
56.1
-74.3
GLY-212
ASP-213
3.0
3.2
1.4
-16.4
74.4
60.3
-0.3
ASP-213
ILE-214
6.7
6.5
28.4
-9.9
5.4
13.0
206.4
ILE-214
ASP-215
5.9
5.2
-33.5
24.2
105.7
117.0
-108.7
ASP-215
LEU-216
3.2
3.2
-11.7
-4.1
128.3
122.9
-100.4
LEU-216
LEU-217
2.9
2.8
3.2
-4.2
88.4
89.1
-40.2
LEU-217
TYR-218
6.0
6.2
-18.9
22.8
149.1
141.4
63.5
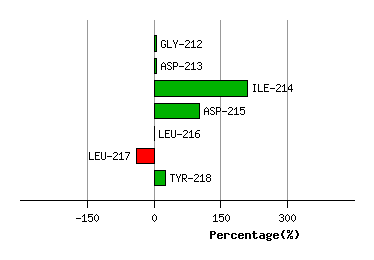
Graph shows rotational transition at bending residues and can be used
to identify hinge bending residues.
Probably only informative for interdomain rotations greater than 20 degrees
Residue
iResidue
i+1Distance of hinge axis to residue i in
(A) Distance of hinge axis to residue i in
(A) Change in
(deg) Change in
(deg) Angle of psi(i) axis to hinge axis
(deg) Angle of psi(i) axis to hinge axis
(deg) Percentage Progress
GLN-241
LEU-242
9.6
10.0
0.4
8.2
75.4
70.5
39.2
LEU-242
SER-243
12.1
12.3
9.4
-3.4
13.0
21.5
26.0
SER-243
GLN-244
11.9
11.9
9.7
0.9
71.3
71.8
14.8
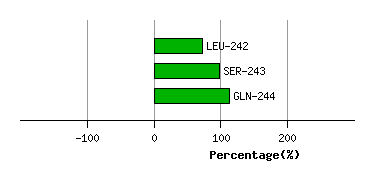
Graph shows rotational transition at bending residues and can be used
to identify hinge bending residues.
Probably only informative for interdomain rotations greater than 20 degrees
Residue
iResidue
i+1Distance of hinge axis to residue i in
(A) Distance of hinge axis to residue i in
(A) Change in
(deg) Change in
(deg) Angle of psi(i) axis to hinge axis
(deg) Angle of psi(i) axis to hinge axis
(deg) Percentage Progress
MET-472
MET-473
11.5
11.5
3.2
-3.9
38.6
33.2
80.3
MET-473
VAL-474
10.2
10.4
-15.5
4.5
104.7
105.3
-82.1
VAL-474
VAL-475
6.7
7.0
-0.3
-0.1
158.5
162.3
29.6
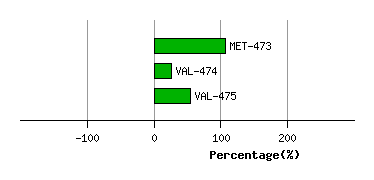
Graph shows rotational transition at bending residues and can be used
to identify hinge bending residues.
Probably only informative for interdomain rotations greater than 20 degrees
Residue
iResidue
i+1Distance of hinge axis to residue i in
(A) Distance of hinge axis to residue i in
(A) Change in
(deg) Change in
(deg) Angle of psi(i) axis to hinge axis
(deg) Angle of psi(i) axis to hinge axis
(deg) Percentage Progress
ILE-483
PRO-484
3.4
4.0
13.3
-0.2
31.2
28.1
55.5
PRO-484
TYR-485
3.4
4.0
4.8
-6.2
83.1
85.3
28.4
TYR-485
ALA-486
4.8
5.0
-8.1
3.8
152.5
144.8
-66.2
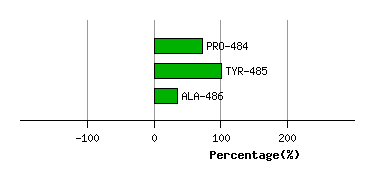
Graph shows rotational transition at bending residues and can be used
to identify hinge bending residues.
Probably only informative for interdomain rotations greater than 20 degrees