Tyrosyl-Trna Synthetase
(All numbering and residues are taken from first PDB file)
![]()
![]()
Bending Residue Dihedral Analysis
Residue
iResidue
i+1Distance of hinge axis to residue i in
(A) Distance of hinge axis to residue i in
(A) Change in
(deg) Change in
(deg) Angle of psi(i) axis to hinge axis
(deg) Angle of psi(i) axis to hinge axis
(deg) Percentage Progress
PHE-108
GLN-109
6.0
5.6
-9.2
13.4
74.8
78.3
-28.5
GLN-109
LEU-110
7.8
7.8
-1.2
-15.4
21.6
23.7
116.4
LEU-110
ASP-111
8.6
8.5
8.6
-9.6
126.7
127.3
19.2
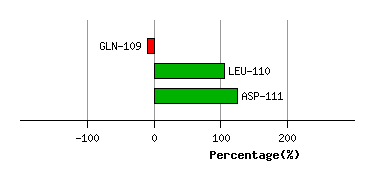
Graph shows rotational transition at bending residues and can be used
to identify hinge bending residues.
Probably only informative for interdomain rotations greater than 20 degrees
Residue
iResidue
i+1Distance of hinge axis to residue i in
(A) Distance of hinge axis to residue i in
(A) Change in
(deg) Change in
(deg) Angle of psi(i) axis to hinge axis
(deg) Angle of psi(i) axis to hinge axis
(deg) Percentage Progress
GLN-155
VAL-156
11.6
11.2
-18.2
31.6
81.7
84.7
21.1
VAL-156
ASN-157
11.7
11.1
-41.9
-9.2
133.9
128.9
-353.7
ASN-157
PRO-158
9.3
8.9
-161.1
-6.3
68.2
70.3
1103.5
PRO-158
LEU-159
7.8
6.6
-24.9
14.8
92.8
51.9
13.9
LEU-159
HIS-160
4.2
6.3
-31.2
9.9
42.6
118.9
-1027.1
HIS-160
TYR-161
4.3
6.7
-25.3
55.1
43.8
115.0
685.9
TYR-161
GLU-162
4.4
3.5
-50.6
-11.2
101.5
54.4
-845.4
GLU-162
GLY-163
4.6
1.2
-135.8
-16.5
52.3
62.2
1055.6
GLY-163
VAL-164
5.6
4.6
23.6
29.3
146.8
173.7
-524.4
VAL-164
ASP-165
3.9
4.0
22.0
1.3
120.5
119.2
59.3
ASP-165
VAL-166
6.2
6.6
6.5
4.3
120.4
125.1
-43.0
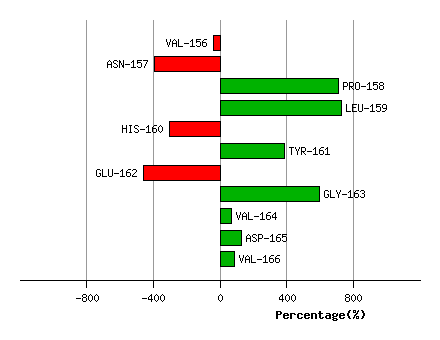
Graph shows rotational transition at bending residues and can be used
to identify hinge bending residues.
Probably only informative for interdomain rotations greater than 20 degrees
Residue
iResidue
i+1Distance of hinge axis to residue i in
(A) Distance of hinge axis to residue i in
(A) Change in
(deg) Change in
(deg) Angle of psi(i) axis to hinge axis
(deg) Angle of psi(i) axis to hinge axis
(deg) Percentage Progress
VAL-168
GLY-169
7.2
7.2
7.5
-12.3
110.8
110.4
43.8
GLY-169
GLY-170
10.7
10.7
21.9
-32.4
43.0
44.9
-55.3
GLY-170
MET-171
13.9
14.1
11.7
-6.9
98.3
94.4
-5.1
MET-171
GLU-172
16.2
16.7
110.4
-114.5
140.0
145.9
32.3
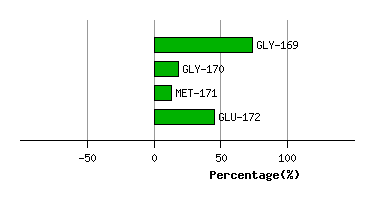
Graph shows rotational transition at bending residues and can be used
to identify hinge bending residues.
Probably only informative for interdomain rotations greater than 20 degrees
Residue
iResidue
i+1Distance of hinge axis to residue i in
(A) Distance of hinge axis to residue i in
(A) Change in
(deg) Change in
(deg) Angle of psi(i) axis to hinge axis
(deg) Angle of psi(i) axis to hinge axis
(deg) Percentage Progress
VAL-188
VAL-189
9.5
10.0
14.5
-26.8
149.6
152.5
106.4
VAL-189
CYS-190
9.5
9.7
-0.4
-2.2
87.7
88.7
-3.8
CYS-190
ILE-191
9.9
10.0
15.4
-18.1
167.6
161.5
-4.6
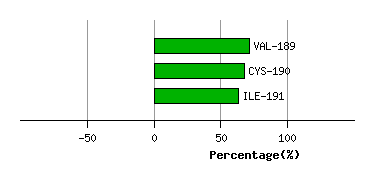
Graph shows rotational transition at bending residues and can be used
to identify hinge bending residues.
Probably only informative for interdomain rotations greater than 20 degrees