Coenzyme A Biosynthesis Bifunctional Protein Coabc
(All numbering and residues are taken from first PDB file)
![]()
![]()
Bending Residue Dihedral Analysis
Residue
iResidue
i+1Distance of hinge axis to residue i in
(A) Distance of hinge axis to residue i in
(A) Change in
(deg) Change in
(deg) Angle of psi(i) axis to hinge axis
(deg) Angle of psi(i) axis to hinge axis
(deg) Percentage Progress
THR-198
ARG-199
4.0
4.2
12.5
1.5
30.1
36.5
57.1
ARG-199
GLU-200
2.7
2.5
19.4
-23.5
77.0
86.7
-14.6
GLU-200
PRO-201
1.4
1.3
4.4
14.4
14.1
26.1
96.9
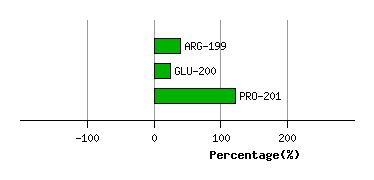
Graph shows rotational transition at bending residues and can be used
to identify hinge bending residues.
Probably only informative for interdomain rotations greater than 20 degrees
Residue
iResidue
i+1Distance of hinge axis to residue i in
(A) Distance of hinge axis to residue i in
(A) Change in
(deg) Change in
(deg) Angle of psi(i) axis to hinge axis
(deg) Angle of psi(i) axis to hinge axis
(deg) Percentage Progress
ILE-208
SER-209
3.8
5.2
26.1
-29.4
54.6
51.9
-66.8
SER-209
ASP-210
4.3
6.0
-50.6
60.7
126.2
120.5
-4.5
ASP-210
HIS-211
7.4
8.5
-6.3
8.7
84.0
71.3
-40.3
HIS-211
SER-212
11.1
11.6
45.2
-21.0
43.0
44.3
104.8
SER-212
SER-213
11.8
12.3
-4.8
-8.5
64.1
59.2
22.6
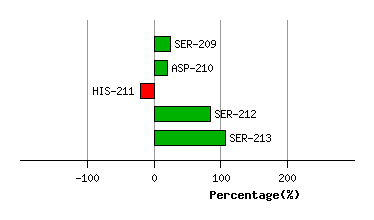
Graph shows rotational transition at bending residues and can be used
to identify hinge bending residues.
Probably only informative for interdomain rotations greater than 20 degrees
Residue
iResidue
i+1Distance of hinge axis to residue i in
(A) Distance of hinge axis to residue i in
(A) Change in
(deg) Change in
(deg) Angle of psi(i) axis to hinge axis
(deg) Angle of psi(i) axis to hinge axis
(deg) Percentage Progress
ASP-279
TYR-280
5.5
5.4
16.1
-5.7
70.1
65.8
10.7
TYR-280
ARG-281
6.6
6.3
2.2
-5.8
39.2
37.4
1.4
ARG-281
ALA-282
5.6
5.6
-33.6
70.1
131.5
121.1
159.7
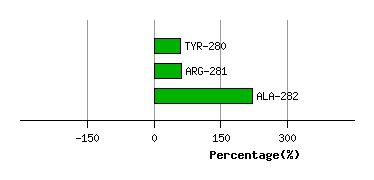
Graph shows rotational transition at bending residues and can be used
to identify hinge bending residues.
Probably only informative for interdomain rotations greater than 20 degrees
Residue
iResidue
i+1Distance of hinge axis to residue i in
(A) Distance of hinge axis to residue i in
(A) Change in
(deg) Change in
(deg) Angle of psi(i) axis to hinge axis
(deg) Angle of psi(i) axis to hinge axis
(deg) Percentage Progress
LYS-306
ASN-307
8.3
8.1
19.2
-18.7
77.9
86.4
-28.9
ASN-307
PRO-308
5.0
5.0
6.5
1.0
7.5
10.6
40.3
PRO-308
ASP-309
4.8
5.0
-2.7
13.9
109.0
108.3
49.6
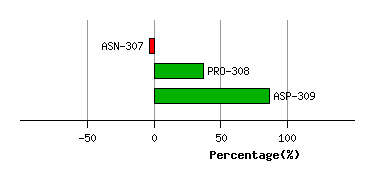
Graph shows rotational transition at bending residues and can be used
to identify hinge bending residues.
Probably only informative for interdomain rotations greater than 20 degrees