Importin-Alpha2 Subunit
(All numbering and residues are taken from first PDB file)
![]()
![]()
Bending Residue Dihedral Analysis
Residue
iResidue
i+1Distance of hinge axis to residue i in
(A) Distance of hinge axis to residue i in
(A) Change in
(deg) Change in
(deg) Angle of psi(i) axis to hinge axis
(deg) Angle of psi(i) axis to hinge axis
(deg) Percentage Progress
LEU-253
PRO-254
8.0
8.2
-0.4
0.0
53.6
49.8
-1.7
PRO-254
THR-255
11.4
11.4
-2.6
-0.6
15.8
17.4
25.8
THR-255
LEU-256
11.0
11.0
-9.9
6.5
65.8
68.7
27.5
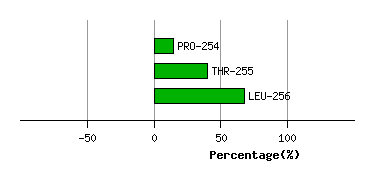
Graph shows rotational transition at bending residues and can be used
to identify hinge bending residues.
Probably only informative for interdomain rotations greater than 20 degrees
Residue
iResidue
i+1Distance of hinge axis to residue i in
(A) Distance of hinge axis to residue i in
(A) Change in
(deg) Change in
(deg) Angle of psi(i) axis to hinge axis
(deg) Angle of psi(i) axis to hinge axis
(deg) Percentage Progress
VAL-257
ARG-258
9.2
8.5
12.4
-6.2
27.1
28.3
61.8
ARG-258
LEU-259
11.3
10.6
-0.2
-2.1
138.8
135.9
-21.9
LEU-259
LEU-260
8.2
7.5
-4.4
1.4
106.9
98.6
-1.3
LEU-260
HIS-261
7.3
6.2
-6.2
-12.7
130.9
125.7
-136.1
HIS-261
HIS-262
10.4
9.4
17.5
-12.2
24.7
25.1
55.7
HIS-262
ASN-263
8.9
8.5
-8.3
21.7
129.4
135.3
122.6
ASN-263
ASP-264
7.7
7.7
-12.4
10.3
110.1
112.6
22.8
ASP-264
PRO-265
4.5
4.6
6.4
-0.4
123.1
115.2
-25.5
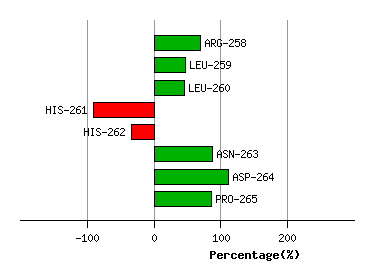
Graph shows rotational transition at bending residues and can be used
to identify hinge bending residues.
Probably only informative for interdomain rotations greater than 20 degrees
Residue
iResidue
i+1Distance of hinge axis to residue i in
(A) Distance of hinge axis to residue i in
(A) Change in
(deg) Change in
(deg) Angle of psi(i) axis to hinge axis
(deg) Angle of psi(i) axis to hinge axis
(deg) Percentage Progress
ASP-270
SER-271
2.4
2.7
10.7
3.2
36.5
41.1
119.1
SER-271
CYS-272
1.9
1.7
-4.0
-0.3
121.2
125.0
-22.5
CYS-272
TRP-273
2.4
2.3
8.5
-9.4
58.8
57.3
-30.0
TRP-273
ALA-274
3.3
3.4
4.5
-3.7
33.0
33.7
14.5
ALA-274
ILE-275
2.0
2.2
-2.1
1.4
136.4
133.6
-6.0
ILE-275
SER-276
1.4
1.4
-0.8
-1.0
112.9
112.6
-2.0
ILE-275
SER-276
1.4
1.4
-0.8
-1.0
112.9
112.6
-2.0
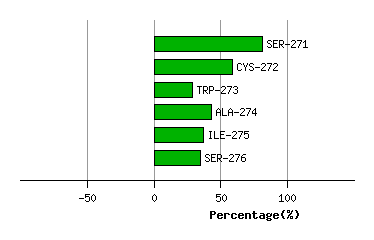
Graph shows rotational transition at bending residues and can be used
to identify hinge bending residues.
Probably only informative for interdomain rotations greater than 20 degrees
Residue
iResidue
i+1Distance of hinge axis to residue i in
(A) Distance of hinge axis to residue i in
(A) Change in
(deg) Change in
(deg) Angle of psi(i) axis to hinge axis
(deg) Angle of psi(i) axis to hinge axis
(deg) Percentage Progress
ILE-275
SER-276
1.4
1.4
-0.8
-1.0
112.9
112.6
-2.0
ILE-275
SER-276
1.4
1.4
-0.8
-1.0
112.9
112.6
-2.0
SER-276
TYR-277
4.3
4.3
4.6
-1.5
45.3
44.3
32.2
TYR-277
LEU-278
4.4
4.3
-8.1
8.0
147.1
146.0
-2.8
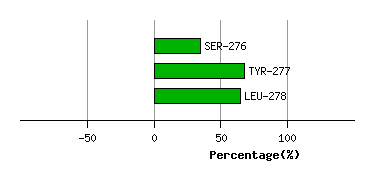
Graph shows rotational transition at bending residues and can be used
to identify hinge bending residues.
Probably only informative for interdomain rotations greater than 20 degrees
Residue
iResidue
i+1Distance of hinge axis to residue i in
(A) Distance of hinge axis to residue i in
(A) Change in
(deg) Change in
(deg) Angle of psi(i) axis to hinge axis
(deg) Angle of psi(i) axis to hinge axis
(deg) Percentage Progress
ASP-280
GLY-281
6.4
6.3
8.5
0.7
155.0
156.9
-87.5
GLY-281
PRO-282
6.0
5.8
0.2
-14.6
132.0
130.5
108.3
PRO-282
ASN-283
5.0
5.2
7.6
8.0
73.0
72.3
29.3
ASN-283
GLU-284
6.3
6.5
-15.1
9.4
86.1
93.8
-10.2
GLU-284
ARG-285
3.8
4.2
2.7
1.5
29.8
27.3
51.7
ARG-285
ILE-286
2.0
2.2
-12.0
4.7
132.7
134.5
-71.5
ILE-286
GLU-287
5.2
5.4
5.6
-7.7
97.1
93.5
-7.5
GLU-287
MET-288
7.4
7.5
-1.7
-0.4
117.2
116.2
-74.0
MET-288
VAL-289
6.7
6.8
27.5
-28.9
11.0
4.4
9.9
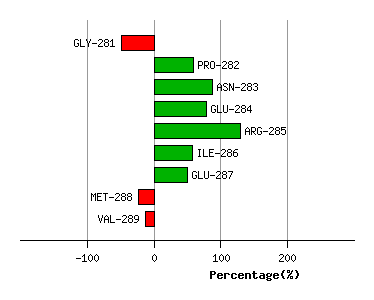
Graph shows rotational transition at bending residues and can be used
to identify hinge bending residues.
Probably only informative for interdomain rotations greater than 20 degrees