Ftsh
(All numbering and residues are taken from first PDB file)
![]()
![]()
Bending Residue Dihedral Analysis
Residue
iResidue
i+1Distance of hinge axis to residue i in
(A) Distance of hinge axis to residue i in
(A) Change in
(deg) Change in
(deg) Angle of psi(i) axis to hinge axis
(deg) Angle of psi(i) axis to hinge axis
(deg) Percentage Progress
ARG-395
VAL-396
14.9
14.4
-7.9
-11.4
28.6
29.2
86.9
VAL-396
MET-397
15.2
15.1
69.5
-83.1
105.1
115.1
-26.3
MET-397
MET-398
13.2
12.8
-6.6
29.7
99.5
109.9
7.5
MET-398
LEU-399
16.6
14.9
-37.7
28.2
77.2
77.7
9.7
LEU-399
PRO-400
19.3
18.1
-13.4
-4.9
24.5
18.7
81.6
PRO-400
ALA-401
19.4
17.1
-110.0
155.0
87.5
92.1
40.9
ALA-401
LYS-402
22.8
16.0
107.6
62.7
47.0
91.9
-340.2
LYS-402
LYS-403
25.3
19.8
23.0
-35.7
41.0
158.5
-42.8
LYS-403
SER-404
24.1
20.0
-120.8
-59.8
78.0
49.8
199.2
SER-404
LEU-405
20.3
16.4
-2.2
70.2
78.2
112.8
-34.5
LEU-405
VAL-406
17.8
14.6
-12.0
3.0
74.0
112.5
-44.0
VAL-406
LEU-407
14.1
11.7
-18.9
-20.5
49.3
89.9
-10.7
LEU-407
SER-408
11.4
11.0
73.9
-10.3
51.4
38.3
143.0
SER-408
PRO-409
11.1
11.2
-11.0
0.8
74.5
78.5
7.6
PRO-409
ARG-410
9.8
9.8
4.4
10.5
111.8
106.9
-28.2
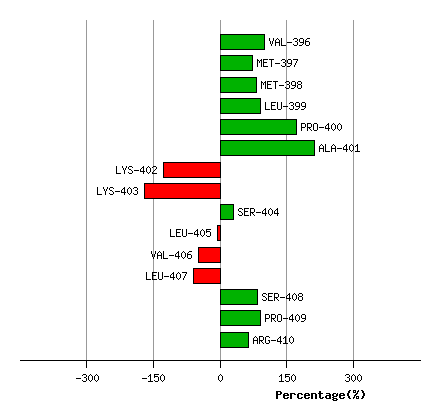
Graph shows rotational transition at bending residues and can be used
to identify hinge bending residues.
Probably only informative for interdomain rotations greater than 20 degrees
Residue
iResidue
i+1Distance of hinge axis to residue i in
(A) Distance of hinge axis to residue i in
(A) Change in
(deg) Change in
(deg) Angle of psi(i) axis to hinge axis
(deg) Angle of psi(i) axis to hinge axis
(deg) Percentage Progress
THR-439
ILE-440
5.2
5.0
8.0
-34.3
123.9
139.8
82.7
ILE-440
VAL-441
6.4
6.2
-32.1
151.3
89.0
79.7
30.8
VAL-441
PRO-442
7.9
7.1
38.0
59.0
26.8
100.9
211.6
PRO-442
ARG-443
9.0
10.4
-12.1
-165.5
93.8
127.0
-191.0
ARG-443
GLY-444
12.9
12.7
25.7
29.7
28.4
16.8
173.2
GLY-444
ARG-445
13.7
10.7
30.2
-45.1
58.1
62.2
4.1
ARG-445
ALA-446
10.9
11.3
27.3
-10.5
82.1
77.6
54.3
ALA-446
LEU-447
12.6
15.0
-64.4
32.5
127.0
159.0
-61.5
LEU-447
GLY-448
14.9
14.5
-19.3
-38.2
147.1
137.8
-143.4
GLY-448
PHE-449
12.3
12.0
-2.9
4.5
57.6
64.0
-21.5
GLY-448
PHE-449
12.3
12.0
-2.9
4.5
57.6
64.0
-21.5
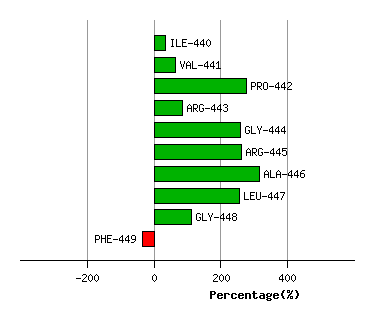
Graph shows rotational transition at bending residues and can be used
to identify hinge bending residues.
Probably only informative for interdomain rotations greater than 20 degrees
Residue
iResidue
i+1Distance of hinge axis to residue i in
(A) Distance of hinge axis to residue i in
(A) Change in
(deg) Change in
(deg) Angle of psi(i) axis to hinge axis
(deg) Angle of psi(i) axis to hinge axis
(deg) Percentage Progress
GLY-448
PHE-449
12.3
12.0
-2.9
4.5
57.6
64.0
-21.5
GLY-448
PHE-449
12.3
12.0
-2.9
4.5
57.6
64.0
-21.5
PHE-449
MET-450
14.5
14.5
-56.9
97.2
60.0
53.1
-80.7
MET-450
MET-451
16.5
17.0
38.5
-10.3
107.0
155.3
-86.8
MET-451
PRO-452
17.0
15.0
8.6
-24.8
124.1
135.1
44.2
PRO-452
ARG-453
13.7
14.6
24.8
17.9
139.1
67.9
-55.5
ARG-453
ARG-454
13.8
18.3
-3.5
-3.4
51.6
46.4
-18.9
ARG-454
GLU-455
17.4
19.3
-44.6
1.0
60.4
34.3
152.2
GLU-455
ASP-456
16.7
16.4
31.9
57.8
113.1
90.2
-113.4
ASP-456
MET-457
13.5
16.0
65.4
179.4
120.4
164.4
340.5
MET-457
LEU-458
15.1
15.3
-22.1
55.5
77.6
59.8
-93.1
LEU-458
HIS-459
14.6
14.3
21.8
-27.8
75.1
100.2
6.8
HIS-459
TRP-460
17.3
16.9
-18.0
10.0
142.3
109.4
39.7
TRP-460
SER-461
18.0
17.8
-10.2
30.6
80.1
65.8
-15.0
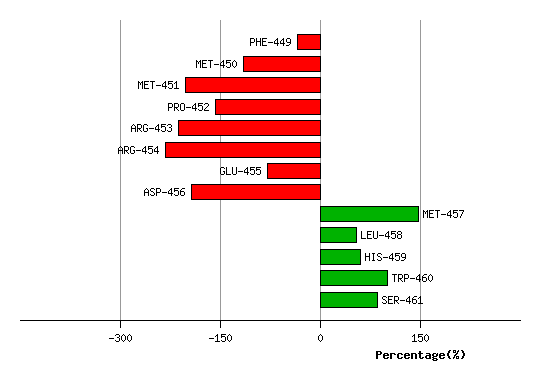
Graph shows rotational transition at bending residues and can be used
to identify hinge bending residues.
Probably only informative for interdomain rotations greater than 20 degrees