Tumor Necrosis Factor Receptor Superfamily Member 4
(All numbering and residues are taken from first PDB file)
![]()
![]()
Bending Residue Dihedral Analysis
Residue
iResidue
i+1Distance of hinge axis to residue i in
(A) Distance of hinge axis to residue i in
(A) Change in
(deg) Change in
(deg) Angle of psi(i) axis to hinge axis
(deg) Angle of psi(i) axis to hinge axis
(deg) Percentage Progress
GLN-114
PRO-115
3.8
4.1
16.6
1.2
55.6
57.6
21.0
PRO-115
LEU-116
6.2
6.6
-26.0
10.7
68.0
60.3
21.0
LEU-116
ASP-117
9.9
10.0
-122.4
16.0
126.8
139.6
-489.0
ASP-117
SER-118
12.0
13.2
-48.0
-46.9
116.1
118.9
-364.6
SER-118
TYR-119
12.8
12.8
-138.1
20.1
169.0
159.9
1301.8
TYR-119
LYS-120
12.9
13.6
-27.1
-4.3
109.5
118.1
-89.0
LYS-120
PRO-121
9.7
10.4
83.3
4.9
140.0
137.6
-354.7
PRO-121
GLY-122
7.4
8.3
-15.2
3.5
85.3
86.5
44.2
PRO-121
GLY-122
7.4
8.3
-15.2
3.5
85.3
86.5
44.2
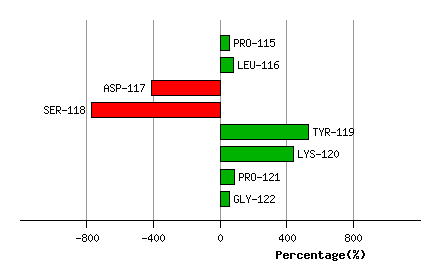
Graph shows rotational transition at bending residues and can be used
to identify hinge bending residues.
Probably only informative for interdomain rotations greater than 20 degrees
Residue
iResidue
i+1Distance of hinge axis to residue i in
(A) Distance of hinge axis to residue i in
(A) Change in
(deg) Change in
(deg) Angle of psi(i) axis to hinge axis
(deg) Angle of psi(i) axis to hinge axis
(deg) Percentage Progress
PRO-121
GLY-122
7.4
8.3
-15.2
3.5
85.3
86.5
44.2
PRO-121
GLY-122
7.4
8.3
-15.2
3.5
85.3
86.5
44.2
GLY-122
VAL-123
4.4
5.2
-9.8
13.7
82.2
86.6
11.6
VAL-123
ASP-124
7.1
7.9
2.3
-8.8
32.2
26.4
-28.7
ASP-124
CYS-125
8.9
9.1
10.8
-10.3
133.8
130.5
-34.8
ASP-124
CYS-125
8.9
9.1
10.8
-10.3
133.8
130.5
-34.8
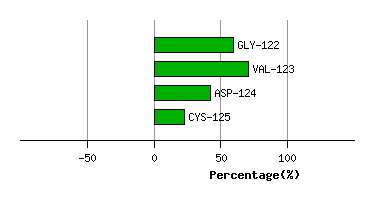
Graph shows rotational transition at bending residues and can be used
to identify hinge bending residues.
Probably only informative for interdomain rotations greater than 20 degrees
Residue
iResidue
i+1Distance of hinge axis to residue i in
(A) Distance of hinge axis to residue i in
(A) Change in
(deg) Change in
(deg) Angle of psi(i) axis to hinge axis
(deg) Angle of psi(i) axis to hinge axis
(deg) Percentage Progress
ASP-124
CYS-125
8.9
9.1
10.8
-10.3
133.8
130.5
-34.8
ASP-124
CYS-125
8.9
9.1
10.8
-10.3
133.8
130.5
-34.8
CYS-125
ALA-126
6.5
6.7
-6.4
3.3
23.5
23.5
36.4
ALA-126
PRO-127
6.8
6.9
1.3
0.2
126.5
121.4
32.8
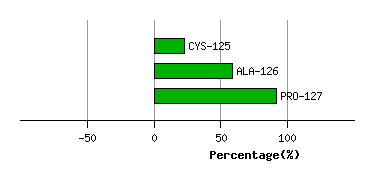
Graph shows rotational transition at bending residues and can be used
to identify hinge bending residues.
Probably only informative for interdomain rotations greater than 20 degrees
Residue
iResidue
i+1Distance of hinge axis to residue i in
(A) Distance of hinge axis to residue i in
(A) Change in
(deg) Change in
(deg) Angle of psi(i) axis to hinge axis
(deg) Angle of psi(i) axis to hinge axis
(deg) Percentage Progress
PHE-133
SER-134
4.6
4.8
-9.1
0.5
23.0
21.9
57.9
SER-134
PRO-135
4.5
4.7
1.5
-8.0
119.8
118.4
2.0
PRO-135
GLY-136
6.4
6.3
13.9
-5.2
138.3
145.1
-40.8
GLY-136
ASP-137
3.5
3.5
-0.3
-7.1
38.7
36.2
11.0
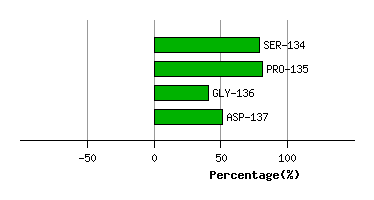
Graph shows rotational transition at bending residues and can be used
to identify hinge bending residues.
Probably only informative for interdomain rotations greater than 20 degrees