Immunoglobulin
(All numbering and residues are taken from first PDB file)
![]()
![]()
Bending Residue Dihedral Analysis
Residue
iResidue
i+1Distance of hinge axis to residue i in
(A) Distance of hinge axis to residue i in
(A) Change in
(deg) Change in
(deg) Angle of psi(i) axis to hinge axis
(deg) Angle of psi(i) axis to hinge axis
(deg) Percentage Progress
GLU-105
ILE-106
4.8
4.6
-3.3
-31.9
8.7
17.1
46.8
ILE-106
LYS-107
3.9
3.9
-9.0
-29.8
58.5
58.0
36.8
LYS-107
ARG-108
2.4
1.8
-0.3
7.1
80.6
55.3
2.2
ARG-108
THR-109
1.5
2.7
5.6
-17.1
116.6
126.9
3.8
THR-109
VAL-110
4.9
4.3
38.9
1.1
51.3
56.8
31.1
VAL-110
ALA-111
6.9
6.9
22.4
-33.7
72.2
79.1
-10.8
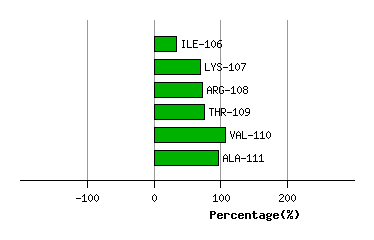
Graph shows rotational transition at bending residues and can be used
to identify hinge bending residues.
Probably only informative for interdomain rotations greater than 20 degrees
Residue
iResidue
i+1Distance of hinge axis to residue i in
(A) Distance of hinge axis to residue i in
(A) Change in
(deg) Change in
(deg) Angle of psi(i) axis to hinge axis
(deg) Angle of psi(i) axis to hinge axis
(deg) Percentage Progress
THR-164
GLU-165
7.2
6.8
51.5
-1.5
65.5
69.5
40.4
GLU-165
GLN-166
3.5
3.4
35.3
19.0
66.6
30.1
50.4
GLN-166
ASP-167
4.0
3.8
10.6
42.4
106.9
97.0
-12.4
ASP-167
SER-168
5.7
7.5
17.7
-157.3
46.0
69.4
-115.1
SER-168
LYS-169
7.7
9.2
-71.6
-55.7
144.3
137.7
284.8
LYS-169
ASP-170
4.8
11.6
-86.4
5.6
166.9
148.7
-88.2
ASP-170
SER-171
6.4
9.8
-44.1
-177.0
84.3
92.8
-68.8
SER-171
THR-172
6.5
6.2
-177.3
47.4
104.5
91.3
-72.5
THR-172
TYR-173
7.0
7.0
8.3
-12.5
154.1
154.4
0.0
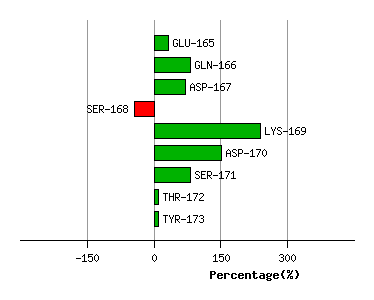
Graph shows rotational transition at bending residues and can be used
to identify hinge bending residues.
Probably only informative for interdomain rotations greater than 20 degrees