Tgf-Beta Receptor Type I
(All numbering and residues are taken from first PDB file)
![]()
![]()
Bending Residue Dihedral Analysis
Residue
iResidue
i+1Distance of hinge axis to residue i in
(A) Distance of hinge axis to residue i in
(A) Change in
(deg) Change in
(deg) Angle of psi(i) axis to hinge axis
(deg) Angle of psi(i) axis to hinge axis
(deg) Percentage Progress
GLY-226
GLU-227
17.9
17.7
-17.3
19.7
120.6
124.9
35.2
GLU-227
GLU-228
16.3
16.2
-2.8
-1.0
77.6
74.6
-2.0
GLU-228
VAL-229
13.7
13.7
2.0
0.8
38.0
43.2
4.2
VAL-229
ALA-230
10.5
10.3
5.2
-10.4
111.0
112.5
24.2
ALA-230
VAL-231
7.4
7.4
-2.5
0.4
97.0
92.0
-2.3
VAL-231
LYS-232
4.0
3.9
-11.7
7.9
82.1
79.6
5.6
LYS-232
ILE-233
1.3
2.3
3.9
0.4
103.7
104.9
24.0
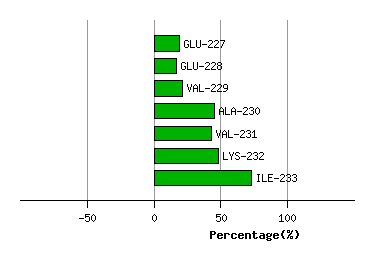
Graph shows rotational transition at bending residues and can be used
to identify hinge bending residues.
Probably only informative for interdomain rotations greater than 20 degrees
Residue
iResidue
i+1Distance of hinge axis to residue i in
(A) Distance of hinge axis to residue i in
(A) Change in
(deg) Change in
(deg) Angle of psi(i) axis to hinge axis
(deg) Angle of psi(i) axis to hinge axis
(deg) Percentage Progress
ILE-248
TYR-249
3.0
3.3
2.8
-1.0
91.0
94.6
-18.4
TYR-249
GLN-250
0.9
0.6
-0.5
7.2
57.8
67.6
-33.1
GLN-250
THR-251
3.0
4.1
-50.4
-30.2
11.3
14.0
410.8
THR-251
VAL-252
1.2
4.3
-147.3
-69.2
120.3
127.1
515.8
THR-251
VAL-252
1.2
4.3
-147.3
-69.2
120.3
127.1
515.8
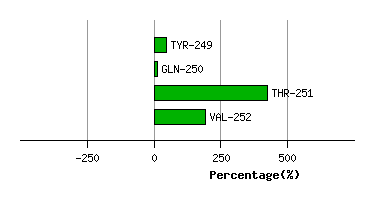
Graph shows rotational transition at bending residues and can be used
to identify hinge bending residues.
Probably only informative for interdomain rotations greater than 20 degrees
Residue
iResidue
i+1Distance of hinge axis to residue i in
(A) Distance of hinge axis to residue i in
(A) Change in
(deg) Change in
(deg) Angle of psi(i) axis to hinge axis
(deg) Angle of psi(i) axis to hinge axis
(deg) Percentage Progress
THR-251
VAL-252
1.2
4.3
-147.3
-69.2
120.3
127.1
515.8
THR-251
VAL-252
1.2
4.3
-147.3
-69.2
120.3
127.1
515.8
VAL-252
MET-253
3.5
0.8
-6.2
-132.0
102.3
73.6
53.5
MET-253
LEU-254
5.5
3.8
74.5
-45.4
121.8
103.7
-56.6
LEU-254
ARG-255
5.0
5.2
117.9
-75.7
115.5
121.2
-137.9
ARG-255
HIS-256
8.2
8.7
-35.2
18.7
117.4
112.9
-60.1
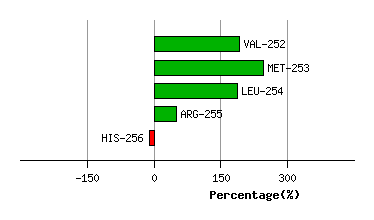
Graph shows rotational transition at bending residues and can be used
to identify hinge bending residues.
Probably only informative for interdomain rotations greater than 20 degrees
Residue
iResidue
i+1Distance of hinge axis to residue i in
(A) Distance of hinge axis to residue i in
(A) Change in
(deg) Change in
(deg) Angle of psi(i) axis to hinge axis
(deg) Angle of psi(i) axis to hinge axis
(deg) Percentage Progress
ALA-264
ALA-265
6.9
6.3
-5.7
-9.0
58.0
61.7
53.6
ALA-265
ASP-266
6.0
5.2
-0.9
16.8
64.0
60.2
-29.9
ASP-266
ASN-267
8.6
7.6
-24.6
3.9
42.3
57.7
56.1
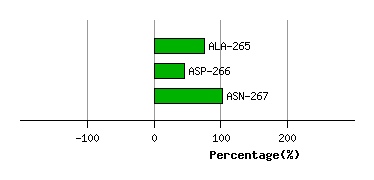
Graph shows rotational transition at bending residues and can be used
to identify hinge bending residues.
Probably only informative for interdomain rotations greater than 20 degrees
Residue
iResidue
i+1Distance of hinge axis to residue i in
(A) Distance of hinge axis to residue i in
(A) Change in
(deg) Change in
(deg) Angle of psi(i) axis to hinge axis
(deg) Angle of psi(i) axis to hinge axis
(deg) Percentage Progress
LEU-276
TRP-277
7.0
6.2
0.2
0.7
96.0
94.5
3.5
TRP-277
LEU-278
4.4
3.4
0.9
-7.2
155.3
156.8
30.1
LEU-278
VAL-279
2.4
1.3
-16.2
15.1
111.7
100.7
-0.8
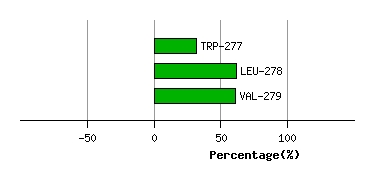
Graph shows rotational transition at bending residues and can be used
to identify hinge bending residues.
Probably only informative for interdomain rotations greater than 20 degrees