Tryptophanase
(All numbering and residues are taken from first PDB file)
![]()
![]()
Bending Residue Dihedral Analysis
Residue
iResidue
i+1Distance of hinge axis to residue i in
(A) Distance of hinge axis to residue i in
(A) Change in
(deg) Change in
(deg) Angle of psi(i) axis to hinge axis
(deg) Angle of psi(i) axis to hinge axis
(deg) Percentage Progress
ILE-16
GLU-17
11.1
9.8
3.3
-10.9
118.8
117.5
15.2
GLU-17
PRO-18
10.0
9.1
5.5
-4.2
47.5
44.9
6.2
PRO-18
VAL-19
13.0
12.0
6.3
2.2
73.7
77.6
19.0
VAL-19
LYS-20
12.8
11.9
27.9
-29.5
57.2
61.5
28.9
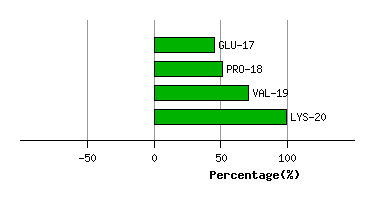
Graph shows rotational transition at bending residues and can be used
to identify hinge bending residues.
Probably only informative for interdomain rotations greater than 20 degrees
Residue
iResidue
i+1Distance of hinge axis to residue i in
(A) Distance of hinge axis to residue i in
(A) Change in
(deg) Change in
(deg) Angle of psi(i) axis to hinge axis
(deg) Angle of psi(i) axis to hinge axis
(deg) Percentage Progress
THR-52
ASP-53
7.6
8.7
2.4
7.9
80.2
73.1
14.2
ASP-53
SER-54
5.6
6.8
-3.8
-1.2
150.3
158.8
-21.6
SER-54
GLY-55
7.6
8.5
-0.7
5.8
139.2
138.5
23.8
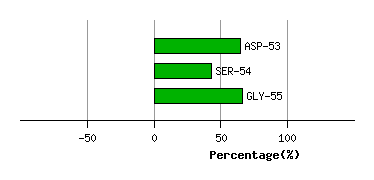
Graph shows rotational transition at bending residues and can be used
to identify hinge bending residues.
Probably only informative for interdomain rotations greater than 20 degrees
Residue
iResidue
i+1Distance of hinge axis to residue i in
(A) Distance of hinge axis to residue i in
(A) Change in
(deg) Change in
(deg) Angle of psi(i) axis to hinge axis
(deg) Angle of psi(i) axis to hinge axis
(deg) Percentage Progress
VAL-338
GLN-339
5.7
6.1
3.2
7.0
13.0
11.4
49.9
GLN-339
TYR-340
7.3
7.8
-11.0
7.6
124.9
122.2
-23.0
TYR-340
LEU-341
5.0
5.1
-4.6
0.0
94.6
96.5
-5.5
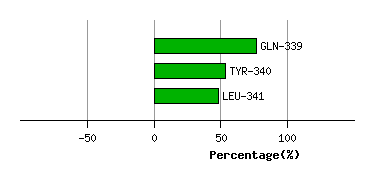
Graph shows rotational transition at bending residues and can be used
to identify hinge bending residues.
Probably only informative for interdomain rotations greater than 20 degrees
Residue
iResidue
i+1Distance of hinge axis to residue i in
(A) Distance of hinge axis to residue i in
(A) Change in
(deg) Change in
(deg) Angle of psi(i) axis to hinge axis
(deg) Angle of psi(i) axis to hinge axis
(deg) Percentage Progress
VAL-350
VAL-351
8.6
9.0
-27.8
41.5
93.4
102.4
3.3
GLN-353
GLN-354
15.6
13.6
-170.0
95.0
107.5
86.2
-30.1
GLN-354
ALA-355
14.6
13.0
-6.4
110.3
114.7
153.9
307.6
ALA-355
GLY-356
11.6
11.0
-2.7
42.8
104.8
134.3
95.4
GLY-356
GLY-357
12.2
12.7
1.4
-19.4
46.3
49.2
-50.3
GLY-357
HIS-358
11.4
12.0
-9.4
-35.9
137.2
119.4
-122.7
HIS-358
ALA-359
11.0
9.3
40.8
-1.5
74.1
65.3
56.5
HIS-358
ALA-359
11.0
9.3
40.8
-1.5
74.1
65.3
56.5
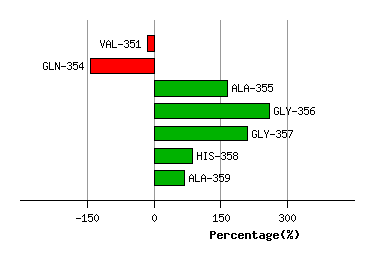
Graph shows rotational transition at bending residues and can be used
to identify hinge bending residues.
Probably only informative for interdomain rotations greater than 20 degrees
Residue
iResidue
i+1Distance of hinge axis to residue i in
(A) Distance of hinge axis to residue i in
(A) Change in
(deg) Change in
(deg) Angle of psi(i) axis to hinge axis
(deg) Angle of psi(i) axis to hinge axis
(deg) Percentage Progress
HIS-358
ALA-359
11.0
9.3
40.8
-1.5
74.1
65.3
56.5
HIS-358
ALA-359
11.0
9.3
40.8
-1.5
74.1
65.3
56.5
ALA-359
ALA-360
9.6
8.1
-10.5
24.9
167.3
165.1
66.2
ALA-360
PHE-361
9.4
8.1
-1.7
3.1
87.6
89.0
-15.3
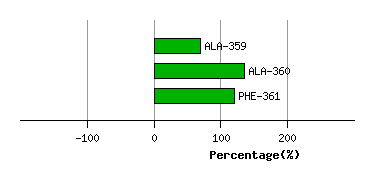
Graph shows rotational transition at bending residues and can be used
to identify hinge bending residues.
Probably only informative for interdomain rotations greater than 20 degrees
Residue
iResidue
i+1Distance of hinge axis to residue i in
(A) Distance of hinge axis to residue i in
(A) Change in
(deg) Change in
(deg) Angle of psi(i) axis to hinge axis
(deg) Angle of psi(i) axis to hinge axis
(deg) Percentage Progress
LEU-420
THR-421
7.8
7.9
-36.8
46.7
119.5
126.8
76.5
THR-421
ILE-422
6.4
7.3
-33.3
24.9
99.0
104.5
7.0
ILE-422
PRO-423
3.1
4.0
1.8
-4.1
28.4
26.8
-9.1
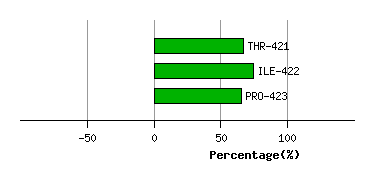
Graph shows rotational transition at bending residues and can be used
to identify hinge bending residues.
Probably only informative for interdomain rotations greater than 20 degrees
Residue
iResidue
i+1Distance of hinge axis to residue i in
(A) Distance of hinge axis to residue i in
(A) Change in
(deg) Change in
(deg) Angle of psi(i) axis to hinge axis
(deg) Angle of psi(i) axis to hinge axis
(deg) Percentage Progress
THR-426
TYR-427
4.3
3.2
-0.5
2.2
135.9
135.5
1.9
TYR-427
THR-428
4.9
3.9
1.1
2.4
49.2
50.5
9.7
THR-428
GLN-429
7.2
6.3
1.2
-2.8
18.5
18.5
0.4
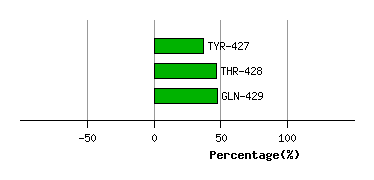
Graph shows rotational transition at bending residues and can be used
to identify hinge bending residues.
Probably only informative for interdomain rotations greater than 20 degrees