Protein Ybgc
(All numbering and residues are taken from first PDB file)
![]()
![]()
Bending Residue Dihedral Analysis
Residue
iResidue
i+1Distance of hinge axis to residue i in
(A) Distance of hinge axis to residue i in
(A) Change in
(deg) Change in
(deg) Angle of psi(i) axis to hinge axis
(deg) Angle of psi(i) axis to hinge axis
(deg) Percentage Progress
LEU-50
MET-51
7.4
7.6
0.3
-1.0
90.5
88.1
4.8
MET-51
ALA-52
10.7
10.9
1.4
-5.2
71.9
73.4
0.8
ALA-52
GLU-53
11.7
12.0
8.6
2.4
134.6
139.0
-122.6
GLU-53
ARG-54
11.9
12.0
-13.4
8.1
37.0
43.1
61.3
ARG-54
VAL-55
13.2
13.5
-2.9
-8.7
38.9
36.8
156.1
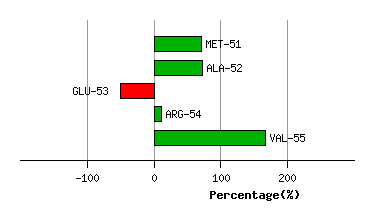
Graph shows rotational transition at bending residues and can be used
to identify hinge bending residues.
Probably only informative for interdomain rotations greater than 20 degrees
Residue
iResidue
i+1Distance of hinge axis to residue i in
(A) Distance of hinge axis to residue i in
(A) Change in
(deg) Change in
(deg) Angle of psi(i) axis to hinge axis
(deg) Angle of psi(i) axis to hinge axis
(deg) Percentage Progress
PHE-57
VAL-58
6.9
7.2
2.6
-0.3
68.3
65.9
-7.1
VAL-58
VAL-59
8.8
9.0
5.8
-2.6
44.8
43.9
30.9
VAL-59
ARG-60
8.3
8.3
2.5
2.2
26.5
27.6
40.9
ARG-60
LYS-61
8.2
8.1
1.1
-2.1
51.4
49.2
3.0
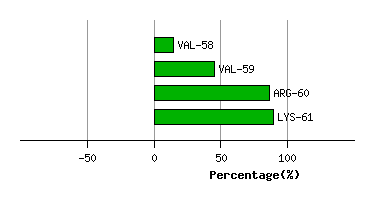
Graph shows rotational transition at bending residues and can be used
to identify hinge bending residues.
Probably only informative for interdomain rotations greater than 20 degrees
Residue
iResidue
i+1Distance of hinge axis to residue i in
(A) Distance of hinge axis to residue i in
(A) Change in
(deg) Change in
(deg) Angle of psi(i) axis to hinge axis
(deg) Angle of psi(i) axis to hinge axis
(deg) Percentage Progress
GLU-81
ILE-82
8.5
8.9
0.3
-7.7
127.5
122.1
61.2
ILE-82
THR-83
5.8
6.3
11.1
-36.0
134.5
136.6
263.7
THR-83
SER-84
7.5
7.6
67.2
-39.3
110.1
123.4
-183.0
SER-84
MET-85
6.3
5.8
-5.8
-22.4
109.1
120.2
-130.9
MET-85
ARG-86
6.1
6.0
-19.9
-37.3
44.3
54.2
470.5
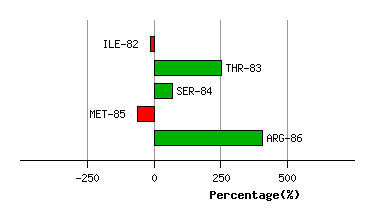
Graph shows rotational transition at bending residues and can be used
to identify hinge bending residues.
Probably only informative for interdomain rotations greater than 20 degrees
Residue
iResidue
i+1Distance of hinge axis to residue i in
(A) Distance of hinge axis to residue i in
(A) Change in
(deg) Change in
(deg) Angle of psi(i) axis to hinge axis
(deg) Angle of psi(i) axis to hinge axis
(deg) Percentage Progress
VAL-91
PHE-92
2.4
2.3
-11.0
-2.5
43.2
49.9
105.4
PHE-92
THR-93
4.9
5.0
5.7
-4.8
61.9
61.2
-2.9
THR-93
GLN-94
8.6
8.7
1.7
-4.1
140.2
140.9
27.4
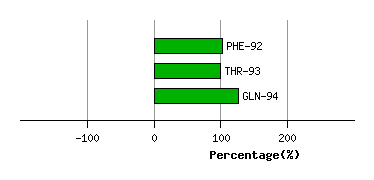
Graph shows rotational transition at bending residues and can be used
to identify hinge bending residues.
Probably only informative for interdomain rotations greater than 20 degrees
Residue
iResidue
i+1Distance of hinge axis to residue i in
(A) Distance of hinge axis to residue i in
(A) Change in
(deg) Change in
(deg) Angle of psi(i) axis to hinge axis
(deg) Angle of psi(i) axis to hinge axis
(deg) Percentage Progress
VAL-109
LEU-110
6.2
6.2
3.4
-5.7
96.8
95.7
15.7
LEU-110
VAL-111
3.5
3.5
0.3
-3.6
55.1
54.1
-4.2
VAL-111
VAL-112
4.2
4.3
0.7
-3.7
101.0
94.9
6.2
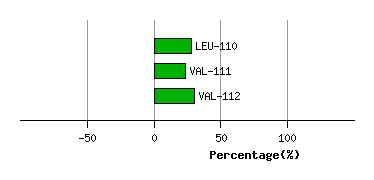
Graph shows rotational transition at bending residues and can be used
to identify hinge bending residues.
Probably only informative for interdomain rotations greater than 20 degrees