Elongation Factor 1-Alpha
(All numbering and residues are taken from first PDB file)
![]()
![]()
Bending Residue Dihedral Analysis
Residue
iResidue
i+1Distance of hinge axis to residue i in
(A) Distance of hinge axis to residue i in
(A) Change in
(deg) Change in
(deg) Angle of psi(i) axis to hinge axis
(deg) Angle of psi(i) axis to hinge axis
(deg) Percentage Progress
THR-87
ILE-88
5.3
5.3
2.5
-1.7
94.4
99.2
-20.3
ILE-88
ILE-89
4.4
4.9
-14.0
19.9
149.7
157.3
21.3
ILE-89
ASP-90
7.3
7.3
174.7
-123.4
84.5
68.7
68.2
ASP-90
ALA-91
9.7
9.3
33.5
-61.9
132.4
138.9
169.1
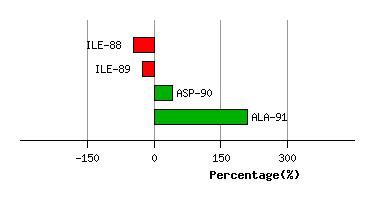
Graph shows rotational transition at bending residues and can be used
to identify hinge bending residues.
Probably only informative for interdomain rotations greater than 20 degrees
Residue
iResidue
i+1Distance of hinge axis to residue i in
(A) Distance of hinge axis to residue i in
(A) Change in
(deg) Change in
(deg) Angle of psi(i) axis to hinge axis
(deg) Angle of psi(i) axis to hinge axis
(deg) Percentage Progress
GLY-104
ALA-105
18.1
18.3
-5.1
5.7
72.6
65.8
5.9
ALA-105
SER-106
14.8
15.2
-3.5
25.5
138.7
137.7
122.1
SER-106
GLN-107
13.3
13.5
-61.1
69.1
140.2
138.0
126.8
GLN-107
ALA-108
14.6
15.0
-30.2
-1.7
145.3
143.3
-264.4
ALA-108
ASP-109
13.4
13.3
18.9
-2.6
43.8
43.1
102.7
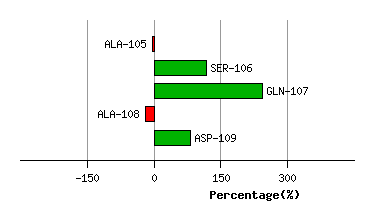
Graph shows rotational transition at bending residues and can be used
to identify hinge bending residues.
Probably only informative for interdomain rotations greater than 20 degrees
Residue
iResidue
i+1Distance of hinge axis to residue i in
(A) Distance of hinge axis to residue i in
(A) Change in
(deg) Change in
(deg) Angle of psi(i) axis to hinge axis
(deg) Angle of psi(i) axis to hinge axis
(deg) Percentage Progress
GLN-221
LEU-222
9.8
10.2
-0.1
-3.1
125.0
128.8
-45.0
LEU-222
GLU-223
11.5
11.7
18.3
-24.3
87.5
81.9
-0.5
GLU-223
LEU-224
15.2
15.3
5.3
9.3
19.0
18.3
133.4
LEU-224
PRO-225
16.9
16.7
-11.9
16.1
88.6
84.9
-16.3
PRO-225
PRO-226
19.8
19.0
-39.6
-2.2
84.6
84.2
106.5
PRO-226
LYS-227
23.4
22.4
13.6
13.1
32.1
50.1
208.0
LYS-227
PRO-228
24.8
25.8
0.3
-41.5
71.7
106.8
29.1
PRO-228
VAL-229
27.7
27.8
85.7
-12.7
120.0
109.8
-295.7
VAL-229
ASP-230
30.1
30.7
0.7
6.9
149.5
140.3
-54.3
ASP-230
LYS-231
29.6
30.5
-10.0
6.6
94.9
104.9
44.3
LYS-231
PRO-232
30.4
31.1
-5.4
3.6
100.9
107.4
-10.8
PRO-232
LEU-233
34.0
34.6
5.2
-10.1
25.7
27.8
-18.8
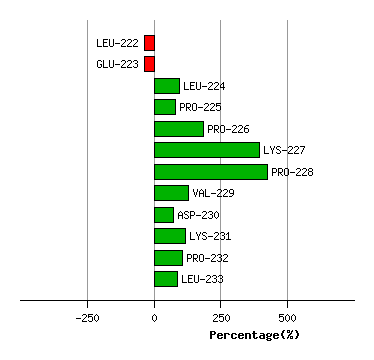
Graph shows rotational transition at bending residues and can be used
to identify hinge bending residues.
Probably only informative for interdomain rotations greater than 20 degrees