Ig Gamma-2a Chain C Region
(All numbering and residues are taken from first PDB file)
![]()
![]()
Bending Residue Dihedral Analysis
Residue
iResidue
i+1Distance of hinge axis to residue i in
(A) Distance of hinge axis to residue i in
(A) Change in
(deg) Change in
(deg) Angle of psi(i) axis to hinge axis
(deg) Angle of psi(i) axis to hinge axis
(deg) Percentage Progress
VAL-264
ASP-265
16.1
15.8
-5.2
-26.5
87.5
100.8
-23.5
ASP-265
ILE-266
19.6
19.1
1.2
45.9
47.7
70.2
176.5
ILE-266
SER-267
19.4
17.7
-4.0
5.5
149.2
145.5
4.1
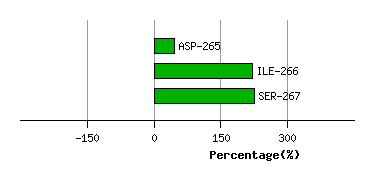
Graph shows rotational transition at bending residues and can be used
to identify hinge bending residues.
Probably only informative for interdomain rotations greater than 20 degrees
Residue
iResidue
i+1Distance of hinge axis to residue i in
(A) Distance of hinge axis to residue i in
(A) Change in
(deg) Change in
(deg) Angle of psi(i) axis to hinge axis
(deg) Angle of psi(i) axis to hinge axis
(deg) Percentage Progress
VAL-273
ARG-274
13.4
13.1
56.8
-61.4
85.2
74.6
-17.0
ARG-274
PHE-275
11.9
12.0
-44.8
42.4
144.8
162.4
-11.1
PHE-275
SER-276
9.5
9.8
16.8
5.8
70.0
63.5
42.9
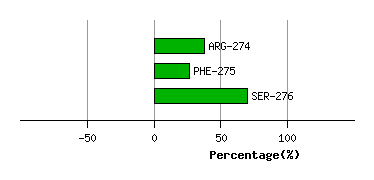
Graph shows rotational transition at bending residues and can be used
to identify hinge bending residues.
Probably only informative for interdomain rotations greater than 20 degrees
Residue
iResidue
i+1Distance of hinge axis to residue i in
(A) Distance of hinge axis to residue i in
(A) Change in
(deg) Change in
(deg) Angle of psi(i) axis to hinge axis
(deg) Angle of psi(i) axis to hinge axis
(deg) Percentage Progress
THR-286
ALA-287
6.8
7.9
19.3
2.3
66.2
74.7
29.8
ALA-287
GLN-288
3.4
4.6
-15.6
17.7
171.7
167.6
8.5
GLN-288
THR-289
1.6
2.6
5.9
-10.0
83.1
79.7
-2.0
THR-289
HIS-290
3.4
3.5
35.9
-42.5
28.7
30.8
-25.5
HIS-290
ALA-291
3.9
3.7
50.5
-51.7
60.5
60.0
-55.3
ALA-291
PRO-292
5.6
6.1
21.4
-34.4
99.0
107.9
-26.0
ALA-291
PRO-292
5.6
6.1
21.4
-34.4
99.0
107.9
-26.0
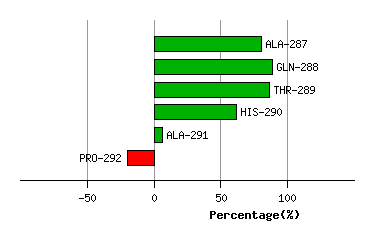
Graph shows rotational transition at bending residues and can be used
to identify hinge bending residues.
Probably only informative for interdomain rotations greater than 20 degrees
Residue
iResidue
i+1Distance of hinge axis to residue i in
(A) Distance of hinge axis to residue i in
(A) Change in
(deg) Change in
(deg) Angle of psi(i) axis to hinge axis
(deg) Angle of psi(i) axis to hinge axis
(deg) Percentage Progress
ALA-291
PRO-292
5.6
6.1
21.4
-34.4
99.0
107.9
-26.0
ALA-291
PRO-292
5.6
6.1
21.4
-34.4
99.0
107.9
-26.0
PRO-292
GLU-293
9.4
9.8
79.2
-56.3
58.8
53.7
85.5
GLU-293
LYS-294
10.5
11.8
-28.7
61.3
78.4
87.6
-33.6
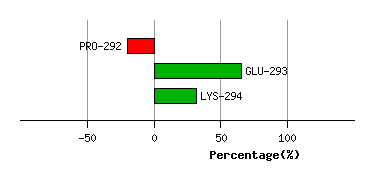
Graph shows rotational transition at bending residues and can be used
to identify hinge bending residues.
Probably only informative for interdomain rotations greater than 20 degrees
Residue
iResidue
i+1Distance of hinge axis to residue i in
(A) Distance of hinge axis to residue i in
(A) Change in
(deg) Change in
(deg) Angle of psi(i) axis to hinge axis
(deg) Angle of psi(i) axis to hinge axis
(deg) Percentage Progress
VAL-303
SER-304
7.2
7.0
45.8
-20.3
83.2
85.1
-6.3
SER-304
GLU-305
4.4
4.2
25.0
-9.8
41.7
43.4
74.2
GLU-305
LEU-306
2.2
1.2
-1.5
6.5
105.1
111.6
-3.9
LEU-306
PRO-307
0.9
1.7
-21.7
13.7
120.5
112.5
-24.5
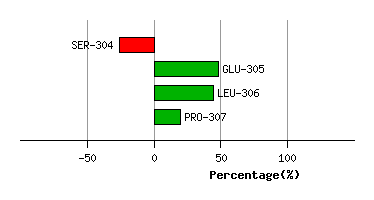
Graph shows rotational transition at bending residues and can be used
to identify hinge bending residues.
Probably only informative for interdomain rotations greater than 20 degrees
Residue
iResidue
i+1Distance of hinge axis to residue i in
(A) Distance of hinge axis to residue i in
(A) Change in
(deg) Change in
(deg) Angle of psi(i) axis to hinge axis
(deg) Angle of psi(i) axis to hinge axis
(deg) Percentage Progress
LYS-322
VAL-323
11.8
12.2
16.3
-24.0
6.4
11.0
-49.7
VAL-323
ASN-324
12.7
13.3
-17.6
6.2
103.7
104.5
-16.7
ASN-324
SER-325
15.7
16.5
6.1
79.0
31.4
20.4
420.3
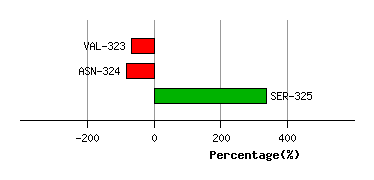
Graph shows rotational transition at bending residues and can be used
to identify hinge bending residues.
Probably only informative for interdomain rotations greater than 20 degrees
Residue
iResidue
i+1Distance of hinge axis to residue i in
(A) Distance of hinge axis to residue i in
(A) Change in
(deg) Change in
(deg) Angle of psi(i) axis to hinge axis
(deg) Angle of psi(i) axis to hinge axis
(deg) Percentage Progress
ILE-332
GLU-333
16.0
16.6
-37.0
74.3
119.9
114.1
166.2
GLU-333
LYS-334
13.6
13.9
33.2
-0.1
31.0
62.5
168.6
LYS-334
SER-335
11.5
11.5
6.1
-30.0
74.2
66.4
-46.3
SER-335
ILE-336
8.6
8.8
-7.4
7.9
117.5
111.8
11.0
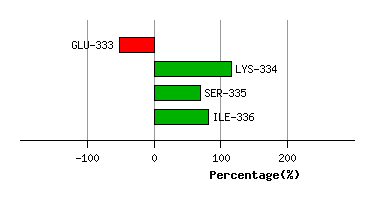
Graph shows rotational transition at bending residues and can be used
to identify hinge bending residues.
Probably only informative for interdomain rotations greater than 20 degrees