Tryptophanyl-Trna Synthetase
(All numbering and residues are taken from first PDB file)
![]()
![]()
Bending Residue Dihedral Analysis
Residue
iResidue
i+1Distance of hinge axis to residue i in
(A) Distance of hinge axis to residue i in
(A) Change in
(deg) Change in
(deg) Angle of psi(i) axis to hinge axis
(deg) Angle of psi(i) axis to hinge axis
(deg) Percentage Progress
SER-110
LYS-111
16.7
17.0
12.4
-9.9
35.1
29.9
35.4
LYS-111
ILE-112
17.1
17.6
-8.6
6.0
88.5
90.6
1.6
ILE-112
ASP-113
14.6
14.9
6.2
-12.7
81.8
80.7
-14.8
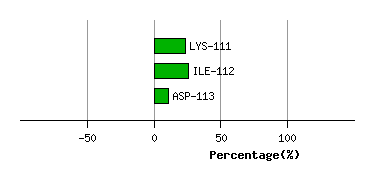
Graph shows rotational transition at bending residues and can be used
to identify hinge bending residues.
Probably only informative for interdomain rotations greater than 20 degrees
Residue
iResidue
i+1Distance of hinge axis to residue i in
(A) Distance of hinge axis to residue i in
(A) Change in
(deg) Change in
(deg) Angle of psi(i) axis to hinge axis
(deg) Angle of psi(i) axis to hinge axis
(deg) Percentage Progress
GLU-115
LEU-116
15.8
15.6
10.0
-5.9
98.3
98.6
63.4
LEU-116
ILE-117
12.3
12.4
-0.5
-2.8
34.8
37.2
43.8
ILE-117
ASN-118
12.3
12.2
-3.8
6.0
97.7
102.8
21.0
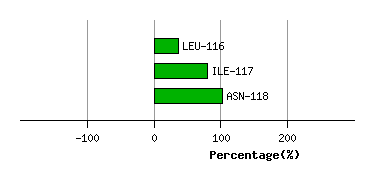
Graph shows rotational transition at bending residues and can be used
to identify hinge bending residues.
Probably only informative for interdomain rotations greater than 20 degrees
Residue
iResidue
i+1Distance of hinge axis to residue i in
(A) Distance of hinge axis to residue i in
(A) Change in
(deg) Change in
(deg) Angle of psi(i) axis to hinge axis
(deg) Angle of psi(i) axis to hinge axis
(deg) Percentage Progress
MET-143
ASN-144
7.1
7.8
-9.0
-7.1
47.9
54.4
196.1
ASN-144
GLN-145
7.2
7.6
1.8
5.9
118.7
126.0
-131.6
GLN-145
VAL-146
4.8
5.4
6.3
-3.2
55.4
55.6
-5.1
VAL-146
LEU-147
2.9
3.4
-10.2
11.5
87.4
92.0
-12.3
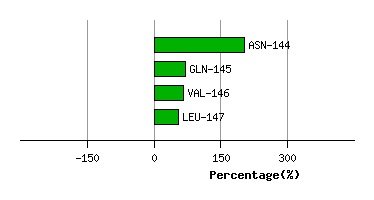
Graph shows rotational transition at bending residues and can be used
to identify hinge bending residues.
Probably only informative for interdomain rotations greater than 20 degrees
Residue
iResidue
i+1Distance of hinge axis to residue i in
(A) Distance of hinge axis to residue i in
(A) Change in
(deg) Change in
(deg) Angle of psi(i) axis to hinge axis
(deg) Angle of psi(i) axis to hinge axis
(deg) Percentage Progress
ALA-168
MET-169
18.2
18.1
66.2
-55.2
51.8
39.2
165.7
MET-169
HIS-170
15.3
15.4
-14.8
23.7
64.2
65.8
-50.1
HIS-170
VAL-171
14.0
14.4
-14.2
5.2
121.6
125.8
-82.2
VAL-171
GLY-172
11.8
11.8
15.5
-11.9
15.0
20.4
51.8
GLY-172
HIS-173
13.7
13.9
-1.9
1.4
129.3
136.0
20.9
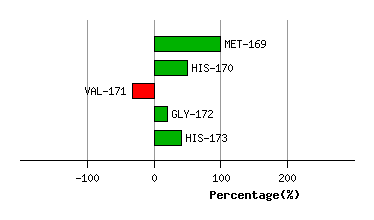
Graph shows rotational transition at bending residues and can be used
to identify hinge bending residues.
Probably only informative for interdomain rotations greater than 20 degrees
Residue
iResidue
i+1Distance of hinge axis to residue i in
(A) Distance of hinge axis to residue i in
(A) Change in
(deg) Change in
(deg) Angle of psi(i) axis to hinge axis
(deg) Angle of psi(i) axis to hinge axis
(deg) Percentage Progress
LYS-181
TRP-182
2.5
2.9
-0.1
2.9
113.2
109.6
50.0
TRP-182
LEU-183
1.1
0.8
2.4
-1.9
11.0
12.6
-8.4
LEU-183
GLN-184
0.6
0.7
1.7
-7.2
80.8
76.2
-26.1
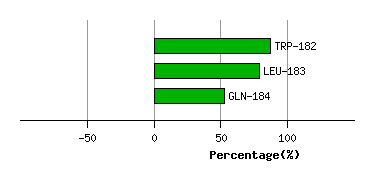
Graph shows rotational transition at bending residues and can be used
to identify hinge bending residues.
Probably only informative for interdomain rotations greater than 20 degrees
Residue
iResidue
i+1Distance of hinge axis to residue i in
(A) Distance of hinge axis to residue i in
(A) Change in
(deg) Change in
(deg) Angle of psi(i) axis to hinge axis
(deg) Angle of psi(i) axis to hinge axis
(deg) Percentage Progress
ASN-188
VAL-189
7.0
6.4
-13.1
12.8
51.5
51.7
-19.5
VAL-189
PRO-190
6.5
6.3
19.8
-15.1
52.5
55.8
102.3
PRO-190
LEU-191
9.2
9.1
4.4
0.9
77.9
78.6
60.3
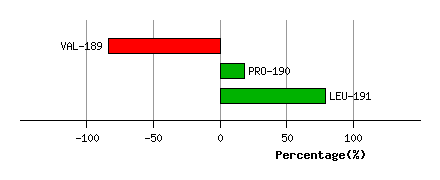
Graph shows rotational transition at bending residues and can be used
to identify hinge bending residues.
Probably only informative for interdomain rotations greater than 20 degrees
Residue
iResidue
i+1Distance of hinge axis to residue i in
(A) Distance of hinge axis to residue i in
(A) Change in
(deg) Change in
(deg) Angle of psi(i) axis to hinge axis
(deg) Angle of psi(i) axis to hinge axis
(deg) Percentage Progress
GLY-226
PHE-227
6.4
6.0
-30.6
15.6
170.6
163.6
-230.6
PHE-227
ASP-228
7.3
7.5
7.9
-12.4
81.5
86.3
17.9
ASP-228
ILE-229
9.6
10.0
8.2
5.8
72.9
81.2
80.2
ILE-229
ASN-230
12.9
13.5
-7.7
-3.7
145.9
156.0
-114.3
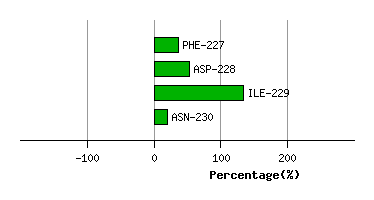
Graph shows rotational transition at bending residues and can be used
to identify hinge bending residues.
Probably only informative for interdomain rotations greater than 20 degrees
Residue
iResidue
i+1Distance of hinge axis to residue i in
(A) Distance of hinge axis to residue i in
(A) Change in
(deg) Change in
(deg) Angle of psi(i) axis to hinge axis
(deg) Angle of psi(i) axis to hinge axis
(deg) Percentage Progress
CYS-305
LEU-306
8.8
8.7
-1.7
-7.8
70.8
71.2
56.2
LEU-306
ILE-307
7.4
7.5
-9.0
17.3
34.2
32.3
-45.1
ILE-307
PRO-308
10.0
10.2
-1.8
-3.9
57.9
50.8
50.0
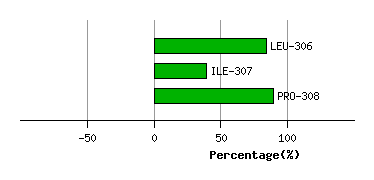
Graph shows rotational transition at bending residues and can be used
to identify hinge bending residues.
Probably only informative for interdomain rotations greater than 20 degrees
Residue
iResidue
i+1Distance of hinge axis to residue i in
(A) Distance of hinge axis to residue i in
(A) Change in
(deg) Change in
(deg) Angle of psi(i) axis to hinge axis
(deg) Angle of psi(i) axis to hinge axis
(deg) Percentage Progress
ILE-311
ASP-312
18.0
18.1
12.0
-13.7
101.2
95.1
16.4
ASP-312
GLN-313
21.2
20.8
23.7
-23.7
110.9
112.9
26.9
GLN-313
ASP-314
19.7
19.1
-8.0
4.1
8.5
5.1
67.9
ASP-314
PRO-315
19.1
18.9
3.2
6.9
124.0
124.4
-89.1
PRO-315
TYR-316
22.3
22.2
-6.8
9.0
90.7
72.0
-82.5
TYR-316
PHE-317
21.6
21.1
-6.0
1.0
54.8
40.6
96.7
PHE-317
ARG-318
18.4
18.0
-13.7
-10.8
19.1
33.4
297.3
ARG-318
MET-319
20.1
19.8
4.6
-7.3
121.2
121.3
-15.6
MET-319
THR-320
21.9
22.0
18.0
-9.9
107.8
111.9
-56.9
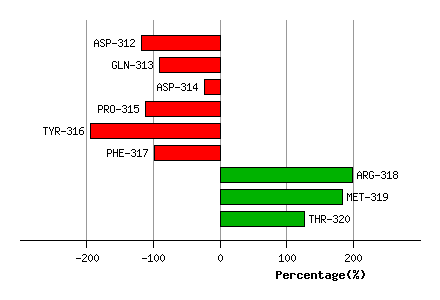
Graph shows rotational transition at bending residues and can be used
to identify hinge bending residues.
Probably only informative for interdomain rotations greater than 20 degrees
Residue
iResidue
i+1Distance of hinge axis to residue i in
(A) Distance of hinge axis to residue i in
(A) Change in
(deg) Change in
(deg) Angle of psi(i) axis to hinge axis
(deg) Angle of psi(i) axis to hinge axis
(deg) Percentage Progress
PRO-332
ALA-333
11.4
11.6
8.7
-15.7
103.0
98.7
-13.2
ALA-333
LEU-334
9.6
9.7
-8.0
3.2
19.7
16.2
100.8
LEU-334
LEU-335
11.1
11.1
-1.3
-4.6
67.4
63.8
65.3
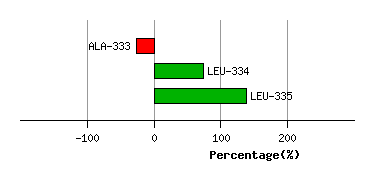
Graph shows rotational transition at bending residues and can be used
to identify hinge bending residues.
Probably only informative for interdomain rotations greater than 20 degrees
Residue
iResidue
i+1Distance of hinge axis to residue i in
(A) Distance of hinge axis to residue i in
(A) Change in
(deg) Change in
(deg) Angle of psi(i) axis to hinge axis
(deg) Angle of psi(i) axis to hinge axis
(deg) Percentage Progress
SER-358
ILE-359
18.0
17.9
5.0
5.0
46.1
51.3
104.5
ILE-359
PHE-360
14.7
14.5
-10.7
-2.0
66.0
67.1
68.2
PHE-360
LEU-361
13.9
14.0
1.0
8.2
82.7
79.5
-63.9
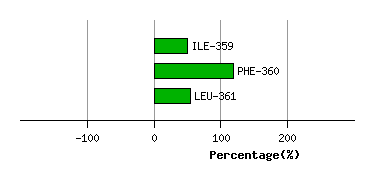
Graph shows rotational transition at bending residues and can be used
to identify hinge bending residues.
Probably only informative for interdomain rotations greater than 20 degrees
Residue
iResidue
i+1Distance of hinge axis to residue i in
(A) Distance of hinge axis to residue i in
(A) Change in
(deg) Change in
(deg) Angle of psi(i) axis to hinge axis
(deg) Angle of psi(i) axis to hinge axis
(deg) Percentage Progress
ALA-365
LYS-366
8.4
8.1
-4.9
4.2
60.4
64.7
45.7
LYS-366
GLN-367
11.2
11.0
-5.9
2.4
123.9
124.0
-61.0
GLN-367
ILE-368
13.6
13.5
7.4
6.1
42.3
42.2
151.6
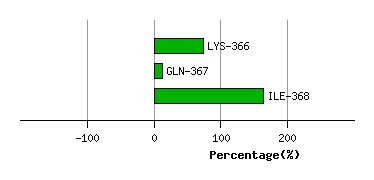
Graph shows rotational transition at bending residues and can be used
to identify hinge bending residues.
Probably only informative for interdomain rotations greater than 20 degrees
Residue
iResidue
i+1Distance of hinge axis to residue i in
(A) Distance of hinge axis to residue i in
(A) Change in
(deg) Change in
(deg) Angle of psi(i) axis to hinge axis
(deg) Angle of psi(i) axis to hinge axis
(deg) Percentage Progress
GLN-439
PRO-440
6.8
6.9
-7.0
6.2
72.3
75.3
-27.0
PRO-440
LEU-441
3.8
4.1
3.0
-9.2
146.9
147.3
113.2
LEU-441
ILE-442
4.3
4.2
-12.9
20.7
101.6
97.8
-81.6
ILE-442
ALA-443
5.8
5.8
-3.9
9.6
53.8
60.2
-39.3
ILE-442
ALA-443
5.8
5.8
-3.9
9.6
53.8
60.2
-39.3
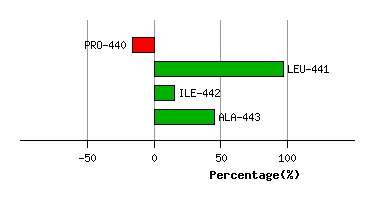
Graph shows rotational transition at bending residues and can be used
to identify hinge bending residues.
Probably only informative for interdomain rotations greater than 20 degrees
Residue
iResidue
i+1Distance of hinge axis to residue i in
(A) Distance of hinge axis to residue i in
(A) Change in
(deg) Change in
(deg) Angle of psi(i) axis to hinge axis
(deg) Angle of psi(i) axis to hinge axis
(deg) Percentage Progress
ILE-442
ALA-443
5.8
5.8
-3.9
9.6
53.8
60.2
-39.3
ILE-442
ALA-443
5.8
5.8
-3.9
9.6
53.8
60.2
-39.3
ALA-443
GLU-444
3.6
3.4
-13.1
6.6
126.1
127.0
-64.0
GLU-444
HIS-445
1.9
1.8
3.6
8.1
58.3
57.2
104.7
HIS-445
GLN-446
5.0
4.7
-4.8
1.4
127.6
120.7
-6.1
HIS-445
GLN-446
5.0
4.7
-4.8
1.4
127.6
120.7
-6.1
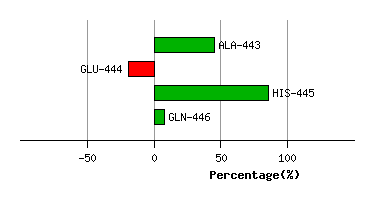
Graph shows rotational transition at bending residues and can be used
to identify hinge bending residues.
Probably only informative for interdomain rotations greater than 20 degrees
Residue
iResidue
i+1Distance of hinge axis to residue i in
(A) Distance of hinge axis to residue i in
(A) Change in
(deg) Change in
(deg) Angle of psi(i) axis to hinge axis
(deg) Angle of psi(i) axis to hinge axis
(deg) Percentage Progress
HIS-445
GLN-446
5.0
4.7
-4.8
1.4
127.6
120.7
-6.1
HIS-445
GLN-446
5.0
4.7
-4.8
1.4
127.6
120.7
-6.1
GLN-446
ALA-447
7.2
7.2
0.0
12.6
106.1
99.2
-13.4
ALA-447
ARG-448
6.6
6.4
-4.9
-12.6
39.8
41.2
215.0
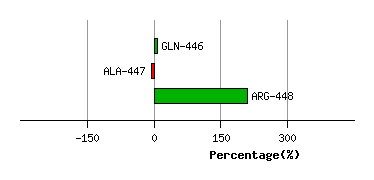
Graph shows rotational transition at bending residues and can be used
to identify hinge bending residues.
Probably only informative for interdomain rotations greater than 20 degrees