Fructose 1-Phosphate Kinase
(All numbering and residues are taken from first PDB file)
![]()
![]()
Bending Residue Dihedral Analysis
Residue
iResidue
i+1Distance of hinge axis to residue i in
(A) Distance of hinge axis to residue i in
(A) Change in
(deg) Change in
(deg) Angle of psi(i) axis to hinge axis
(deg) Angle of psi(i) axis to hinge axis
(deg) Percentage Progress
PHE-7
ASN-8
6.8
6.3
5.4
-7.1
91.8
88.9
5.6
ASN-8
PRO-9
4.7
3.9
7.7
-6.3
158.8
158.1
10.5
PRO-9
SER-10
3.7
2.8
-7.9
9.7
85.6
94.8
44.3
SER-10
ILE-11
4.4
4.0
14.2
-10.7
149.9
149.9
-15.4
ILE-11
ASP-12
5.5
5.7
-11.1
12.7
87.6
88.3
23.5
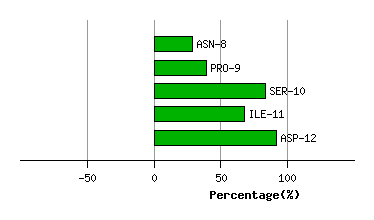
Graph shows rotational transition at bending residues and can be used
to identify hinge bending residues.
Probably only informative for interdomain rotations greater than 20 degrees
Residue
iResidue
i+1Distance of hinge axis to residue i in
(A) Distance of hinge axis to residue i in
(A) Change in
(deg) Change in
(deg) Angle of psi(i) axis to hinge axis
(deg) Angle of psi(i) axis to hinge axis
(deg) Percentage Progress
PHE-34
ALA-35
5.1
5.4
-25.7
2.7
31.3
32.5
137.9
ALA-35
GLY-36
2.9
2.5
7.2
1.0
100.2
104.3
-40.5
GLY-36
GLY-37
6.0
5.1
-23.6
27.4
37.8
50.9
6.1
GLY-37
LYS-38
7.5
6.5
-6.6
-9.6
113.9
116.1
-5.8
LYS-38
GLY-39
10.8
10.0
21.8
-11.1
66.4
74.1
44.8
GLY-39
ILE-40
10.5
9.8
1.8
-3.9
37.7
32.4
7.5
ILE-40
ASN-41
7.5
7.1
1.5
8.9
34.7
38.5
38.7
ASN-41
VAL-42
9.5
9.2
-7.9
2.9
109.8
110.9
-29.4
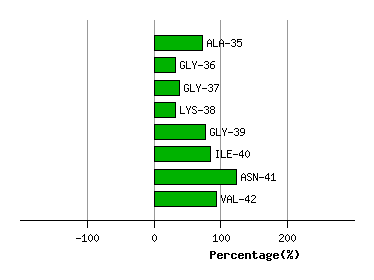
Graph shows rotational transition at bending residues and can be used
to identify hinge bending residues.
Probably only informative for interdomain rotations greater than 20 degrees
Residue
iResidue
i+1Distance of hinge axis to residue i in
(A) Distance of hinge axis to residue i in
(A) Change in
(deg) Change in
(deg) Angle of psi(i) axis to hinge axis
(deg) Angle of psi(i) axis to hinge axis
(deg) Percentage Progress
GLU-85
ASP-86
6.2
6.9
-13.2
10.1
20.1
18.8
3.1
ASP-86
THR-87
6.1
6.9
5.0
-0.9
102.5
101.5
33.7
THR-87
ARG-88
3.2
3.9
-0.8
4.0
82.0
84.7
-20.0
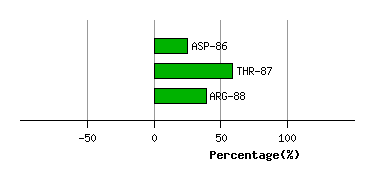
Graph shows rotational transition at bending residues and can be used
to identify hinge bending residues.
Probably only informative for interdomain rotations greater than 20 degrees
Residue
iResidue
i+1Distance of hinge axis to residue i in
(A) Distance of hinge axis to residue i in
(A) Change in
(deg) Change in
(deg) Angle of psi(i) axis to hinge axis
(deg) Angle of psi(i) axis to hinge axis
(deg) Percentage Progress
PRO-104
GLY-105
8.0
7.7
-3.1
2.8
113.6
109.3
-19.5
GLY-105
PRO-106
4.3
4.0
-8.0
-4.5
61.3
55.9
73.7
PRO-106
HIS-107
2.7
3.0
-1.7
0.9
32.6
37.1
-0.2
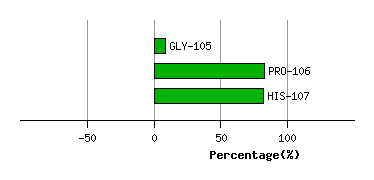
Graph shows rotational transition at bending residues and can be used
to identify hinge bending residues.
Probably only informative for interdomain rotations greater than 20 degrees