Ornithine Transcarbamylase
(All numbering and residues are taken from first PDB file)
![]()
![]()
Bending Residue Dihedral Analysis
Residue
iResidue
i+1Distance of hinge axis to residue i in
(A) Distance of hinge axis to residue i in
(A) Change in
(deg) Change in
(deg) Angle of psi(i) axis to hinge axis
(deg) Angle of psi(i) axis to hinge axis
(deg) Percentage Progress
VAL-159
TYR-160
4.2
4.2
4.2
-0.5
110.0
110.4
-14.2
TYR-160
ALA-161
3.5
3.7
4.3
-0.5
35.7
38.4
46.7
ALA-161
GLY-162
2.2
2.8
1.2
3.7
92.0
93.7
-16.9
GLY-162
ASP-163
5.7
6.3
14.4
3.9
65.2
62.8
89.2
ASP-163
ALA-164
8.8
9.4
-44.4
59.7
70.1
78.9
-55.1
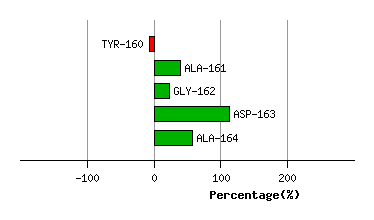
Graph shows rotational transition at bending residues and can be used
to identify hinge bending residues.
Probably only informative for interdomain rotations greater than 20 degrees
Residue
iResidue
i+1Distance of hinge axis to residue i in
(A) Distance of hinge axis to residue i in
(A) Change in
(deg) Change in
(deg) Angle of psi(i) axis to hinge axis
(deg) Angle of psi(i) axis to hinge axis
(deg) Percentage Progress
PHE-227
ILE-228
5.7
5.4
-6.7
9.0
139.2
139.7
-24.2
ILE-228
TYR-229
2.7
2.3
-5.7
3.6
60.7
59.5
-14.1
TYR-229
THR-230
1.5
1.8
2.6
4.7
51.3
54.5
43.7
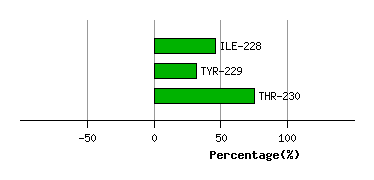
Graph shows rotational transition at bending residues and can be used
to identify hinge bending residues.
Probably only informative for interdomain rotations greater than 20 degrees
Residue
iResidue
i+1Distance of hinge axis to residue i in
(A) Distance of hinge axis to residue i in
(A) Change in
(deg) Change in
(deg) Angle of psi(i) axis to hinge axis
(deg) Angle of psi(i) axis to hinge axis
(deg) Percentage Progress
LYS-258
MET-259
12.0
11.7
-1.1
-2.1
78.2
81.4
6.6
MET-259
MET-260
8.3
8.0
4.0
-2.6
51.4
48.1
11.4
MET-260
GLN-261
8.9
8.7
7.7
-2.9
109.2
106.3
-59.6
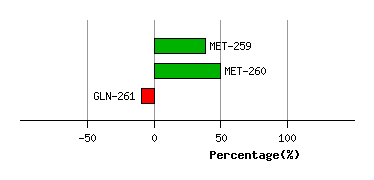
Graph shows rotational transition at bending residues and can be used
to identify hinge bending residues.
Probably only informative for interdomain rotations greater than 20 degrees
Residue
iResidue
i+1Distance of hinge axis to residue i in
(A) Distance of hinge axis to residue i in
(A) Change in
(deg) Change in
(deg) Angle of psi(i) axis to hinge axis
(deg) Angle of psi(i) axis to hinge axis
(deg) Percentage Progress
PHE-270
LEU-271
2.8
2.7
-8.8
6.9
58.1
59.7
-2.9
LEU-271
HIS-272
1.1
1.1
1.1
-2.0
66.1
64.1
-7.2
HIS-272
CYS-273
4.6
4.7
-3.2
11.0
55.2
54.0
44.6
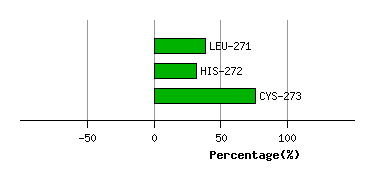
Graph shows rotational transition at bending residues and can be used
to identify hinge bending residues.
Probably only informative for interdomain rotations greater than 20 degrees
Residue
iResidue
i+1Distance of hinge axis to residue i in
(A) Distance of hinge axis to residue i in
(A) Change in
(deg) Change in
(deg) Angle of psi(i) axis to hinge axis
(deg) Angle of psi(i) axis to hinge axis
(deg) Percentage Progress
VAL-304
PHE-305
9.4
9.4
-4.8
4.9
135.5
139.2
15.2
PHE-305
GLU-306
8.1
8.2
-1.9
1.8
156.3
157.2
4.1
GLU-306
SER-307
9.8
10.0
-19.8
4.4
88.9
96.5
-55.1
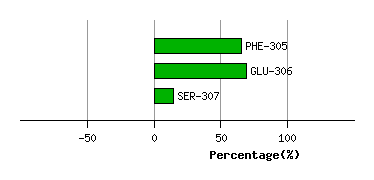
Graph shows rotational transition at bending residues and can be used
to identify hinge bending residues.
Probably only informative for interdomain rotations greater than 20 degrees
Residue
iResidue
i+1Distance of hinge axis to residue i in
(A) Distance of hinge axis to residue i in
(A) Change in
(deg) Change in
(deg) Angle of psi(i) axis to hinge axis
(deg) Angle of psi(i) axis to hinge axis
(deg) Percentage Progress
SER-310
ILE-311
4.5
4.7
-13.6
-8.9
37.8
38.4
234.8
ILE-311
VAL-312
1.9
1.7
5.2
-11.6
94.4
92.2
115.7
VAL-312
PHE-313
2.2
2.6
16.8
4.2
148.0
152.3
-199.5
PHE-313
ASP-314
3.1
3.3
-4.3
-1.2
115.4
114.9
-62.5
PHE-313
ASP-314
3.1
3.3
-4.3
-1.2
115.4
114.9
-62.5
Graph shows rotational transition at bending residues and can be used
to identify hinge bending residues.
Probably only informative for interdomain rotations greater than 20 degrees
Residue
iResidue
i+1Distance of hinge axis to residue i in
(A) Distance of hinge axis to residue i in
(A) Change in
(deg) Change in
(deg) Angle of psi(i) axis to hinge axis
(deg) Angle of psi(i) axis to hinge axis
(deg) Percentage Progress
PHE-313
ASP-314
3.1
3.3
-4.3
-1.2
115.4
114.9
-62.5
PHE-313
ASP-314
3.1
3.3
-4.3
-1.2
115.4
114.9
-62.5
ASP-314
GLN-315
2.3
2.2
-0.4
-1.7
57.0
61.6
50.6
GLN-315
ALA-316
4.5
4.6
-6.9
5.4
110.9
110.6
-27.9
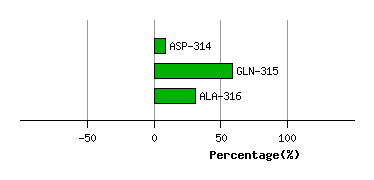
Graph shows rotational transition at bending residues and can be used
to identify hinge bending residues.
Probably only informative for interdomain rotations greater than 20 degrees