Importin Alpha Subunit
(All numbering and residues are taken from first PDB file)
![]()
![]()
Bending Residue Dihedral Analysis
Residue
iResidue
i+1Distance of hinge axis to residue i in
(A) Distance of hinge axis to residue i in
(A) Change in
(deg) Change in
(deg) Angle of psi(i) axis to hinge axis
(deg) Angle of psi(i) axis to hinge axis
(deg) Percentage Progress
LEU-259
PRO-260
2.6
1.8
-1.2
-0.9
79.1
76.9
2.5
PRO-260
THR-261
6.3
5.5
-6.7
9.4
54.1
55.6
-2.3
THR-261
LEU-262
7.6
6.9
-7.5
1.4
22.1
19.8
41.7
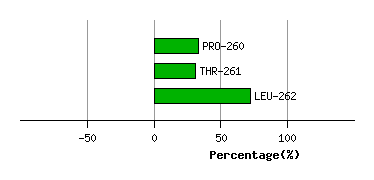
Graph shows rotational transition at bending residues and can be used
to identify hinge bending residues.
Probably only informative for interdomain rotations greater than 20 degrees
Residue
iResidue
i+1Distance of hinge axis to residue i in
(A) Distance of hinge axis to residue i in
(A) Change in
(deg) Change in
(deg) Angle of psi(i) axis to hinge axis
(deg) Angle of psi(i) axis to hinge axis
(deg) Percentage Progress
LEU-265
ILE-266
8.9
8.3
2.5
1.2
26.4
23.8
17.1
ILE-266
TYR-267
6.8
6.1
2.7
-8.3
61.2
57.0
12.6
TYR-267
SER-268
10.2
9.5
-1.8
6.2
112.8
102.9
-8.5
SER-268
MET-269
11.6
11.2
-11.0
26.0
170.8
172.4
127.6
MET-269
ASP-270
12.2
12.8
-19.0
4.9
109.0
103.6
-77.0
ASP-270
THR-271
13.1
13.4
-11.1
1.9
98.0
101.4
-20.9
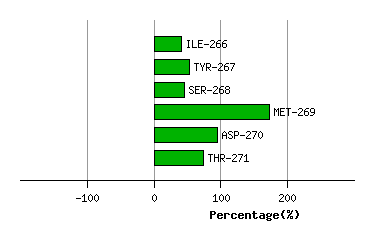
Graph shows rotational transition at bending residues and can be used
to identify hinge bending residues.
Probably only informative for interdomain rotations greater than 20 degrees
Residue
iResidue
i+1Distance of hinge axis to residue i in
(A) Distance of hinge axis to residue i in
(A) Change in
(deg) Change in
(deg) Angle of psi(i) axis to hinge axis
(deg) Angle of psi(i) axis to hinge axis
(deg) Percentage Progress
SER-282
TYR-283
5.5
6.1
2.3
2.3
46.3
46.2
29.4
TYR-283
LEU-284
7.9
8.3
5.4
-6.0
37.9
39.2
-9.8
LEU-284
SER-285
5.7
6.2
-1.8
2.1
78.8
75.4
-0.4
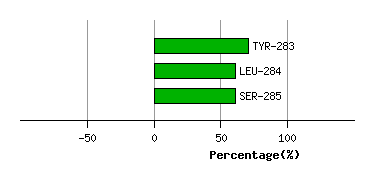
Graph shows rotational transition at bending residues and can be used
to identify hinge bending residues.
Probably only informative for interdomain rotations greater than 20 degrees