Putative Phosphinothricin N-Acetyltransferase Pa4866
(All numbering and residues are taken from first PDB file)
![]()
![]()
Bending Residue Dihedral Analysis
Residue
iResidue
i+1Distance of hinge axis to residue i in
(A) Distance of hinge axis to residue i in
(A) Change in
(deg) Change in
(deg) Angle of psi(i) axis to hinge axis
(deg) Angle of psi(i) axis to hinge axis
(deg) Percentage Progress
GLY-72
ASP-73
6.8
6.6
0.0
-10.2
135.6
129.0
144.1
ASP-73
TRP-74
7.6
7.5
5.5
-8.2
144.4
146.9
123.4
TRP-74
ARG-75
5.4
5.5
-3.7
5.7
41.9
42.1
-66.2
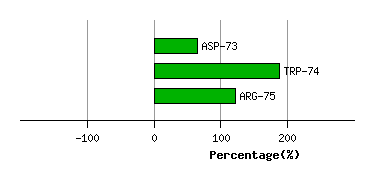
Graph shows rotational transition at bending residues and can be used
to identify hinge bending residues.
Probably only informative for interdomain rotations greater than 20 degrees
Residue
iResidue
i+1Distance of hinge axis to residue i in
(A) Distance of hinge axis to residue i in
(A) Change in
(deg) Change in
(deg) Angle of psi(i) axis to hinge axis
(deg) Angle of psi(i) axis to hinge axis
(deg) Percentage Progress
THR-83
VAL-84
6.0
5.9
-6.5
6.5
82.6
82.3
-43.5
VAL-84
GLU-85
3.4
3.2
-4.3
10.5
119.8
124.0
17.2
GLU-85
HIS-86
2.3
2.3
-8.5
3.8
53.9
51.5
108.7
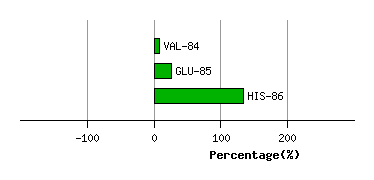
Graph shows rotational transition at bending residues and can be used
to identify hinge bending residues.
Probably only informative for interdomain rotations greater than 20 degrees
Residue
iResidue
i+1Distance of hinge axis to residue i in
(A) Distance of hinge axis to residue i in
(A) Change in
(deg) Change in
(deg) Angle of psi(i) axis to hinge axis
(deg) Angle of psi(i) axis to hinge axis
(deg) Percentage Progress
ALA-113
GLN-114
5.2
4.9
-1.8
-0.3
81.2
76.1
35.5
GLN-114
GLY-115
5.9
5.6
-0.5
-6.8
57.4
56.8
119.3
GLY-115
LEU-116
8.7
8.4
8.0
-2.7
170.3
171.8
-64.3
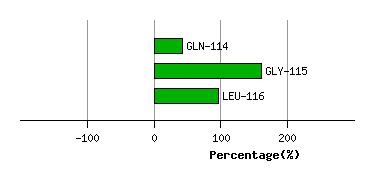
Graph shows rotational transition at bending residues and can be used
to identify hinge bending residues.
Probably only informative for interdomain rotations greater than 20 degrees
Residue
iResidue
i+1Distance of hinge axis to residue i in
(A) Distance of hinge axis to residue i in
(A) Change in
(deg) Change in
(deg) Angle of psi(i) axis to hinge axis
(deg) Angle of psi(i) axis to hinge axis
(deg) Percentage Progress
GLU-140
ILE-141
11.4
11.4
4.0
1.9
43.8
44.4
-29.1
ILE-141
SER-142
9.9
9.8
1.2
-4.8
68.1
71.3
7.9
SER-142
GLY-143
8.1
7.9
-7.6
12.4
140.1
136.7
56.9
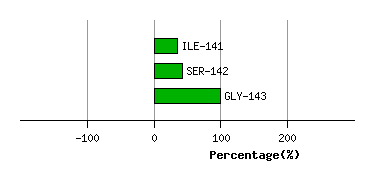
Graph shows rotational transition at bending residues and can be used
to identify hinge bending residues.
Probably only informative for interdomain rotations greater than 20 degrees
Residue
iResidue
i+1Distance of hinge axis to residue i in
(A) Distance of hinge axis to residue i in
(A) Change in
(deg) Change in
(deg) Angle of psi(i) axis to hinge axis
(deg) Angle of psi(i) axis to hinge axis
(deg) Percentage Progress
LEU-158
THR-159
6.7
6.8
-1.0
4.2
101.6
100.4
-55.7
THR-159
PHE-160
6.9
6.8
1.7
7.0
36.0
37.0
105.2
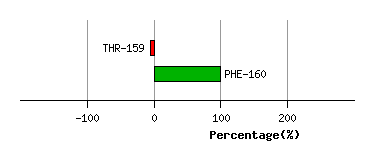
Graph shows rotational transition at bending residues and can be used
to identify hinge bending residues.
Probably only informative for interdomain rotations greater than 20 degrees